Figure 1.
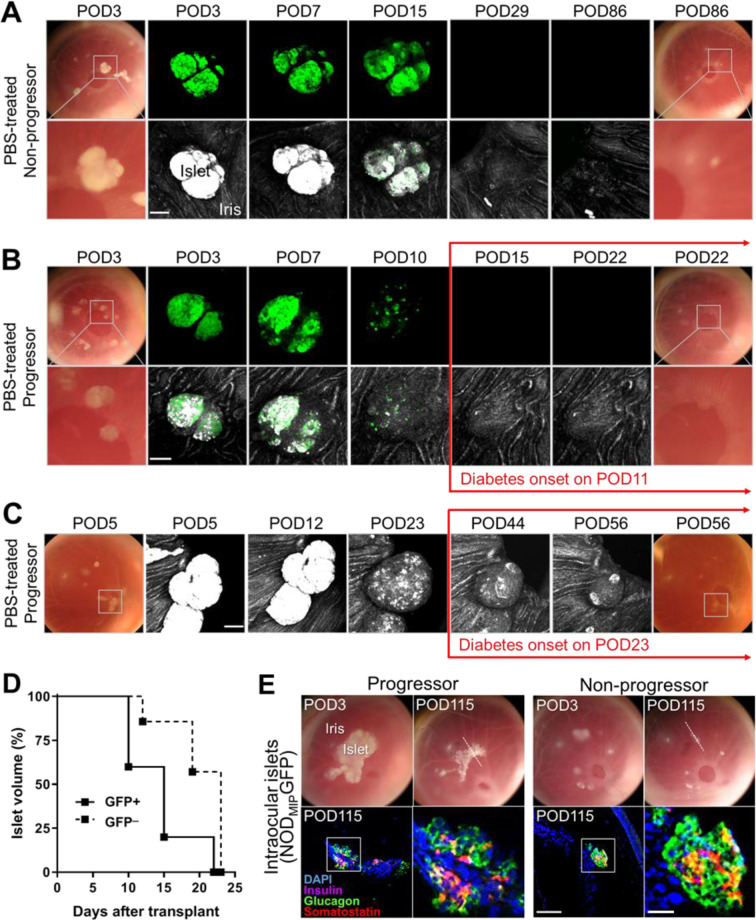
NODMIPGFP islets are attacked in both progressor and nonprogressor NOD mice independently of autoimmune T1D. (A, B) Representative images (digital photos) and confocal micrographs of NODMIPGFP islets transplanted in the ACE of late prediabetic female NODs (16 to 20 wk old) that either (A) did not progress or (B) progressed to diabetes (hyperglycemia). Islets were clearly visible initially on top of the iris as dense white masses (bottom rows) and corresponding GFP signal (top rows) and became less dense and visible as they were attacked and destroyed. Both progressors and nonprogressors were treated with PBS as control treatment starting on POD8 and PBS intraperitoneal injections were given for five consecutive days (see Methods). The micrographs were acquired in z-stacks (shown as maximum intensity projections). Top rows, on the far left and right, show images of the same eyes at baseline (3 d after transplant; POD3) and at (A) POD86 in the nonprogressor and (B) POD22, which is after diabetes/hyperglycemia onset on POD11. Shown in the middle are longitudinal confocal micrographs of a representative islet pair (in box) in the GFP channel (green) where the GFP-expressing beta cells are clearly visible up to ∼POD15. The bottom rows show, on the far left and right, zoomed images of the boxed islet pair at baseline and POD22 and POD86 in progressors and nonprogressors, respectively, and longitudinal confocal micrographs of the same islet pair in the reflection (backscatter; middle) channel where the islets (white/bright gray) are initially visible on top of the iris surface (gray). (C) Longitudinal (POD5 to POD56) images and confocal micrographs of representative ACE-transplanted wild-type NOD (GFP_) islets in PBS-treated progressor counterparts (16 to 20 wk old at transplant) before and after diabetes/hyperglycemia onset on POD23. Scale bars = 100 µm. (D) Kaplan−Meier curves showing the destruction kinetics of individual NODMIPGFP (GFP+) islets (n = 5 islets in two mice) and wild-type (GFP_) islets (n = 7 islets in two mice) in wild-type prediabetic female NOD recipients that progressed to hyperglycemia/diabetes. (E) Longitudinal images (top) of the same eyes of progressor and nonprogressor NOD recipients of ACE-transplanted NODMIPGFP islets on 3 d after transplantation (POD3) and on POD115. White dotted line in POD115 images shows the location of the cross-section of the eye where immunostaining was performed after necropsy on POD115 (bottom). Shown are fluorescence confocal micrographs of eye sections (corresponding to the location identified by the dotted line on top) that were immunostained for insulin, glucagon, somatostatin, and DAPI nuclear counterstain. Scale bar = 50 µm. Zoomed images on the right correspond to the boxed area in each image on the left. Scale bar = 200 µm. ACE: anterior chamber of the eye; GFP: green fluorescent protein; NOD: nonobese diabetic; PBS: phosphate-buffered saline; POD: postoperative day.

