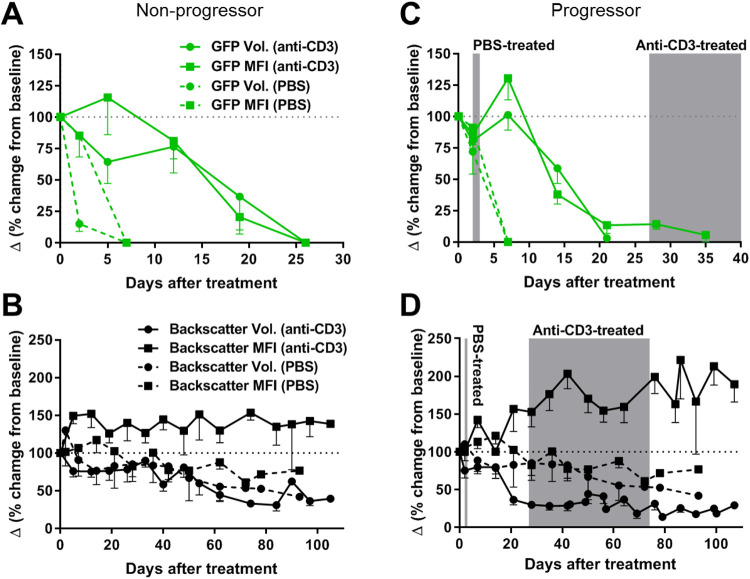
Figure 3.
Quantitative analysis of the volume and granularity of ACE-transplanted NODMIPGFP islets and GFP-expressing beta cells. (A, B) Analysis of volume (round symbols) and MFI (square symbols) of (A, C) beta cell mass (based on GFP fluorescence) and (B, D) volume/granularity of NODMIPGFP islets (based on laser backscatter/reflection signal) in (A, B) nonprogressor and (C,D) progressor recipients that were treated as indicated either with PBS (dashed lines) or anti-CD3 mAb (solid lines). Gray areas in C and D indicate the time range of diabetes/hyperglycemia onset for the indicated treatment group (PBS or anti-CD3). All data were normalized to baseline (measured at or before the start of treatment; day 0) and are presented as Δ (delta) measured based on the % change relative to baseline (dotted horizontal lines at 100%). All data are presented as means ± SEM. n = 7 to 21 islets in three PBS-treated mice and five anti-CD3-treated mice. ACE: anterior chamber of the eye; GFP: green fluorescent protein; MFI: median fluorescence intensity; NOD: nonobese diabetic; PBS: phosphate-buffered saline.

