Figure 1.
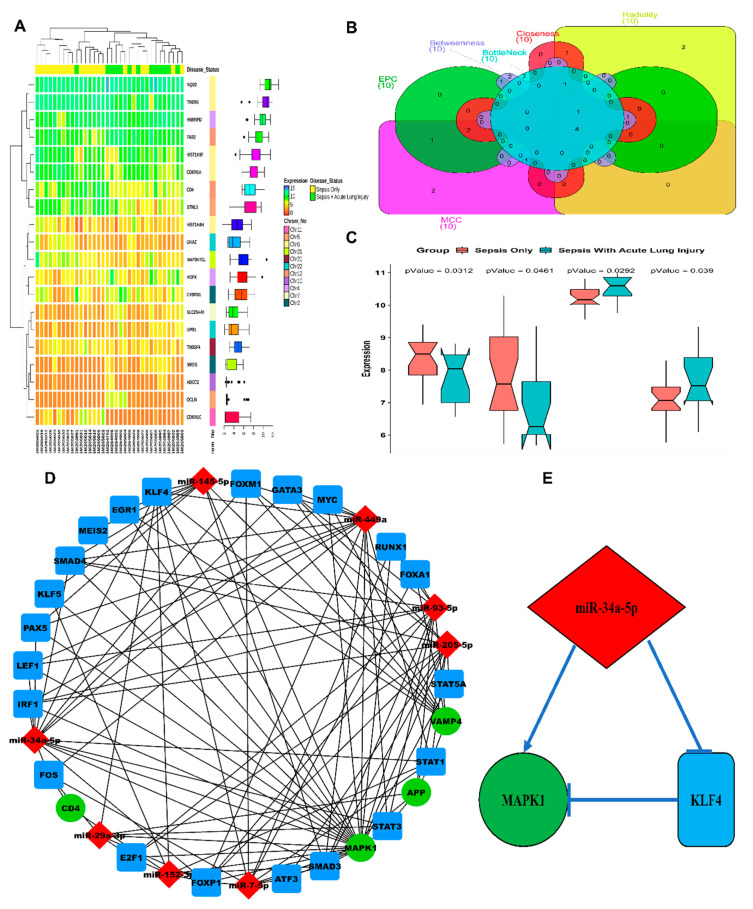
In silico analysis of differentially expressed genes (DEGs) and miRNAs in acute lung injury patients. (A) Heatmap plot of top 10 up and down-regulated DEGs. The expression values for each DEG (row) are normalized across all the samples (columns). Hierarchical clustering using Pearson metric and complete linkage method were used for categorizing the data into two disease status groups, i.e., sepsis only and sepsis with acute lung injury. Cluster dendrograms for row and column are displayed along the left and the top sides of the plot. The location of each DEG on its respective chromosome is shown in the right as the row annotation bar. The boxplots in the right panel display the expression data distribution density of each DEG. The line inside each boxplot represents the median, whereas the endpoints of the axis are labelled by minimum and maximum values. (B) Venn plot for identifying the significant hub genes from the protein–protein interaction (PPI) network. Areas with varying colours correspond to different centralities (maximal clique centrality, i.e., MCC, edge percolated component, i.e., EPC, closeness, betweenness, bottleneck, and radiality). Top 10 ranked PPI DEGs based on each of the six centrality measures are shown in the Venn plot by different gene set colours, and their intersectional area reveals the four hub genes. (C) Notched boxplots comparing the relative expression levels of our hub genes (App, Cd4, Mapk1, Vamp4) in two different groups, i.e., sepsis only and sepsis with acute lung injury. Significance for aggregated expression values was determined by the Wilcoxon p-values. The notches signify a 95% confidence interval for medians. (D) Graphical plot of a three-node miRNA feed-forward loop (FFL) regulatory network. The nodes in green signify our hub genes, nodes in red and blue signifiy the acute lung injury (ALI)/acute respiratory distress syndrome (ARDS)-linked miRNAs and transcription factors (TFs), respectively. (E) The higher-order subnetwork comprising one miRNA (miR-34a-5p), TF (Klf4), and our hub gene (Mapk1) along with their relative regulatory interaction type.

