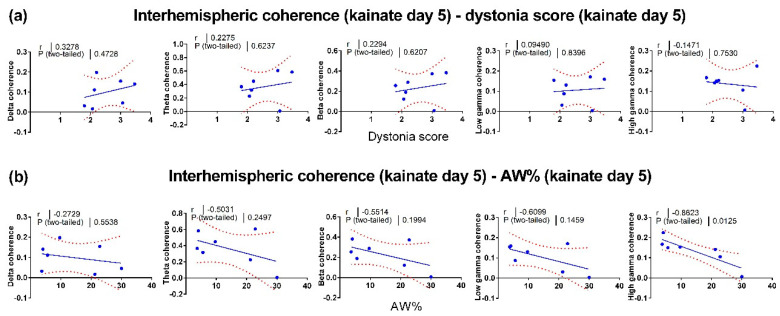
Figure 5.
Pearson correlations between left and right motor cortices (interhemispheric) coherence and behavior on the fifth day of cerebellar kainate application. (a) Linear regression of dystonia score in kainate day 5 versus interhemispheric coherence (delta, theta, beta, low gamma, high gamma bands). (b) Linear regression of active wake percentage versus interhemispheric coherence (delta, theta, beta, low gamma, high gamma bands) in kainate day 5. Each point corresponds to one subject. The plain and dotted curves denote the 95% tolerance and confidence intervals of the linear regression, correspondingly. R and p values are indicated above on each graph.

