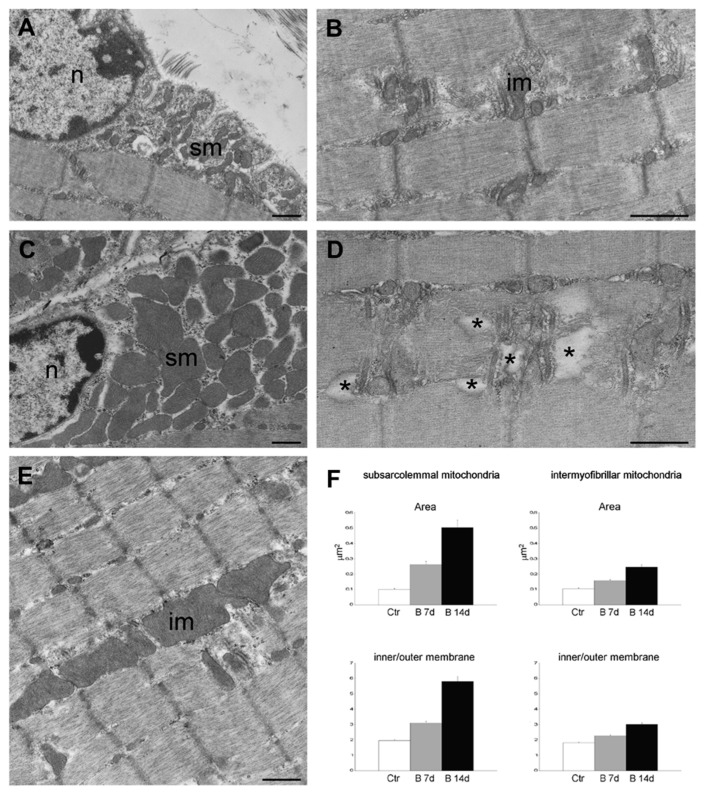
Figure 5.
Transmission electron micrographs of gastrocnemius muscles from control mice (A,B) and mice treated for 14 days with bortezomib (C–E). Note the large-sized subsarcolemmal (sm) and intermyofibrillar (im) mitochondria in C and E compared to the mitochondria in A and B, and the sarcoplasmic enlargements in D (asterisks). Nucleus (n). Bars: 500 nm. (F) Histograms in F show the mean ± SE values of sectional area and inner/outer membrane ratio of subsarcolemmal and intermyofibrillar mitochondria in gastrocnemius muscles from control mice and mice treated for 7 or 14 days with bortezomib. All values are significantly different from each other.

