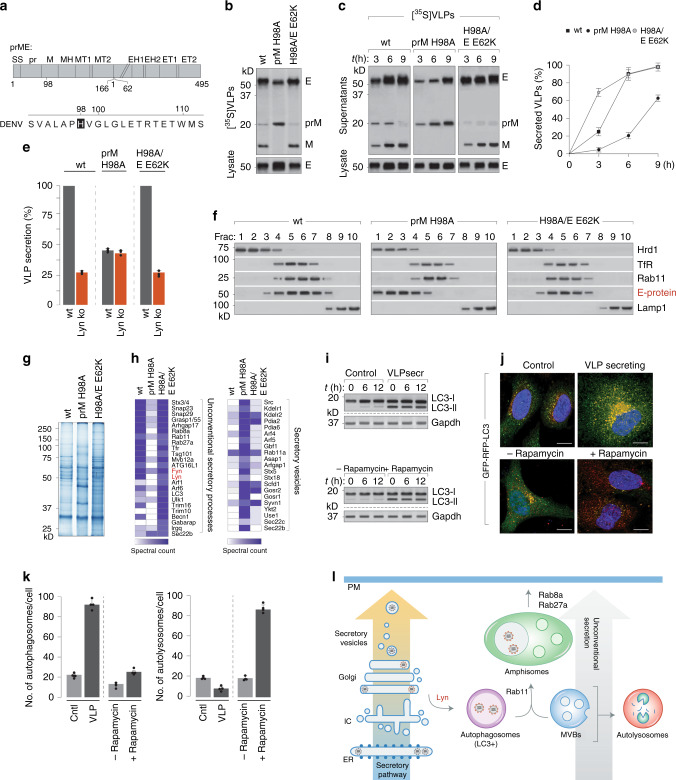
Fig. 6. Lyn-dependent virus transport from the Golgi is specifically triggered by processed, mature virions.
a Schematic of prME with mutations that confer furin resistance. b Radiolabelled VLPs, either wild type or carrying indicated mutations, were purified from supernatants of [35S]cys/met-labelled cells. VLPs were resolved by SDS-PAGE and detected by autoradiography. c Time courses of VLP secretion were measured from radiolabelled wild-type cells and detected by autoradiography. d Quantitation of VLP secretion was performed by densitometric analyses on the autoradiogram from c to measure the fraction of secreted-to-total E protein, and presented as % of control (wild type, maximum secretion set at 100%). Error bars represent mean ± s.d., n = 3. e VLP secretion for wild-type, H98A and H98A/E62K variants was measured from wild-type (grey bars) and Lyn−/− cells (red bars) as described in c, quantitated by densitometric analyses and presented as % of control (wt VLPs secreted from wt cells, set at 100%). Error bars represent mean ± s.d.; n = 3. f VLPs (wild type, H98A and H98A/E62K) were fractionated on sucrose and Optiprep gradients as described in Fig. 5 to detect their subcellular distribution. g VLP-containing fractions co-migrating with Lyn on OptiPrep gradients described in f were scaled up, resolved by gel electrophoresis and detected by Coomassie staining. h Whole lanes were sliced into 1-mm sections and subjected to trypsin digest. The peptide mix was processed and analysed by LTQ Orbitrap mass spectrometer. i Control and VLP-secreting cells were immunoblotted for LC3-I/II; rapamycin-induced autophagosomes served as controls. j Control or VLP-secreting cells (upper panel) were stably transfected with GFP–RFP–LC3 reporter; control cells cultured in media±rapamycin (lower panel). Scale bars, 10 µm. k Formation of autophagosomes was measured by counting fluorescent puncta that were GFP+ and RFP+ (n =~1000 cells) and presented as abundance per cell. Autolysosomes were measured by quantitating RFP+red puncta over ~1000 cells. Error bars represent mean ± s.d.; n = 4. l Schematic of the secretion for immature versus processed mature virions through the conventional secretory pathway versus unconventional secretory organelles.

