Figure 3.
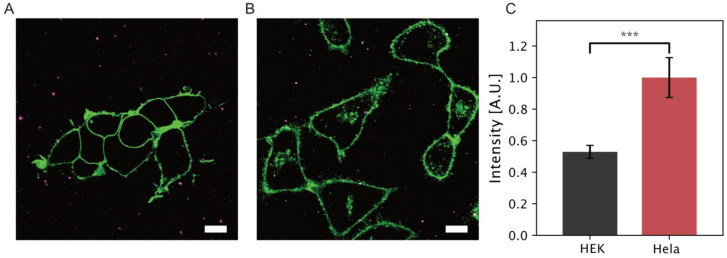
Two-color imaging displaying (A) HEK-293 cells and (B) Hela cells labeled with CellMask Red and SL micelles loaded with DiO. Scale bar 10 µm. (C) Quantification of total normalized intensity of DiO localized on the membrane or inside the cells. A two-fold increase of the DiO signal is observed with Hela cells, indicating a stronger interaction and higher internalization in Hela cell as compared to healthy HEK-293 counterparts. Data from 12 individual images per condition (three technical and two biological replicates resulting in six total repeats). Error bars corresponds to one standard deviation, (*** p < 0.0001).

