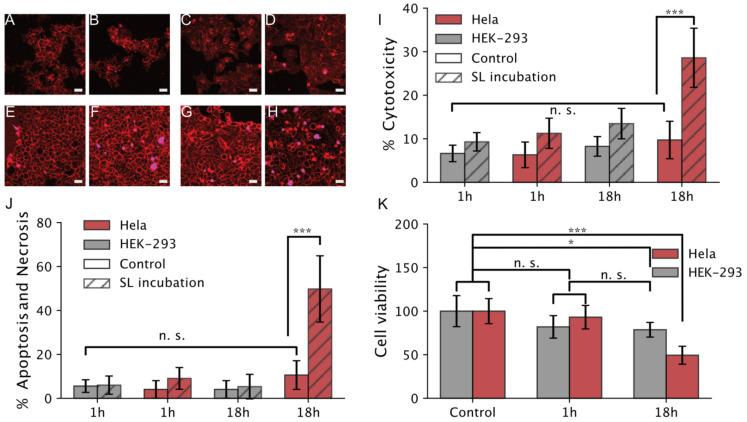
Figure 4.
Cell viability assay for SL micelles and their effect on mammalian Hela and HEK-293 cell lines (scale bar 10 µm). (A,B) HEK-293 in control and SL micelles, respectively, after 1 h of incubation with SLs. (C,D) Hela cells in control and SL micelles, respectively, after 1 h of incubation. (E,F) HEK-293 cells in control and SL micelles, respectively, after 18 h of incubation. (G,H) Hela cells in control and SL micelles, respectively, after 18 h of incubation. The experiment was recorded under a confocal microscope at 1 h and 18 h of incubation with SL micelles. The control sample was kept with both cell lines to the measurement of SL micelles’ cytotoxic behavior. (I) Graphical representation of cytotoxicity obtained from the incubation of SL micelles with HEK-293 and Hela cells using NucGreen. Error bars correspond to one standard deviation. (J) Percentage of cells displaying late apoptosis or necrosis after incubation with SLs. (K) MTT cell viability after 1 h and 18 h of incubation with SLs. Error bars correspond to one standard deviation (error bars in all graphs are from two biological samples with three technical repetitions, resulting in six total repeats), (* p < 0.01, *** p < 0.0001).

