Figure 2.
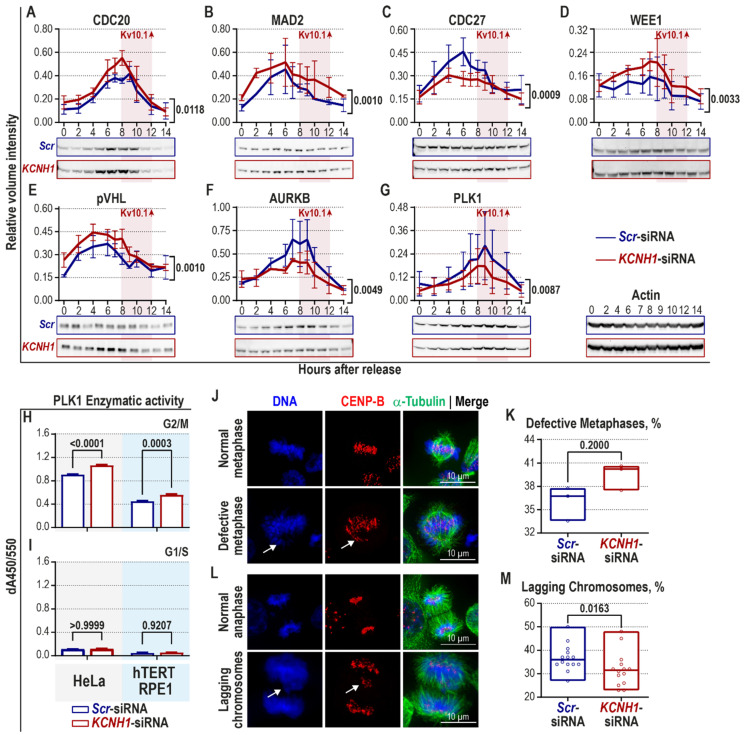
Activation of SAC in Kv10.1-depleted HeLa cells decreases the occurrence of lagging chromosomes. HeLa cells were transiently transfected with either Scr- or KCNH1-siRNA and synchronized with double thymidine block at the G1/S border (A–I) or with consecutive thymidine and nocodazole treatments at metaphase and anaphase (J–M). (A–G) Samples were collected at the indicated time-points after cell cycle re-initiation and immunoblotted. Representative immunoblots and densitometry analysis results are given. The time interval corresponding to Kv10.1 expression is highlighted in pink (n = 3 independent synchronization experiments; mean ± SEM, two-way ANOVA, repeated measures, Bonferroni post hoc test, the given p-value shows the significance of the global difference between the two groups. (H,I) PLK1 enzymatic activity was measured in whole-cell lysates from HeLa (left grey panel) and hTERT RPE1 (right blue panel) cells synchronized at G2/M (H) and G1/S (I) (n = 4 independent synchronization experiments; two-way ANOVA, repeated measures, mean ± SEM is shown). (J–M) The mitotic spindles in synchronized HeLa cells were visualized with α-tubulin (green), and the chromosomes—with CENP-B (kinetochores, red) and Hoechst 33342 (DNA, blue) (scale bars represent, 10 µm and apply for all panels). (J) Metaphase is considered defective when chromosomes (overlap of CENP-B and Hoechst stains) are not properly aligned (indicated with arrows) or damaged DNA (only Hoechst positive) is present. Example images of normal and defective metaphases are shown. (K) The percentage of defective metaphases from the total number of metaphases is plotted (600 metaphases per experiment, n = 4 independent synchronization experiments; Mann–Whitney U-test, min to max range with the median indicated as a line are shown). (L) Lagging chromosomes in anaphase are detected as CENP-B- and Hoechst-positive signal located in the middle part of the spindle (indicated with arrows). (M) The percentage of anaphases with lagging chromosomes from the total number of anaphases is plotted (400 anaphases per experiment, n = 4 independent synchronization experiments; Mann–Whitney U-test, min to max range with the median indicated as a line are shown). (SAC—spindle assembly checkpoint; CDC—cell division cycle protein; MAD2—mitotic arrest deficient 2; pVHL—von Hippel-Lindau protein; AURKB—Aurora kinase B; PLK1—Polo-like kinase 1; CENP-B—centromere protein B).

