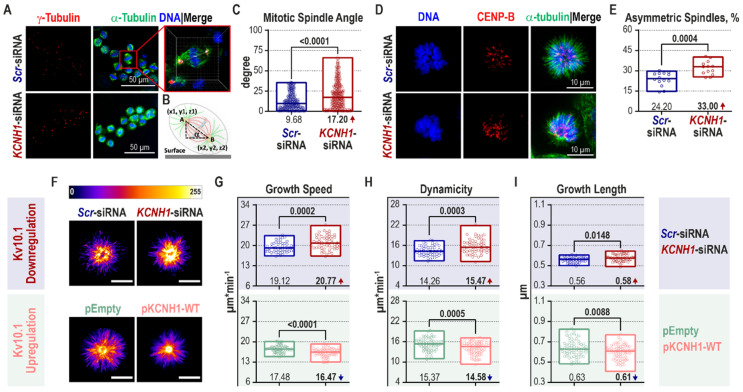
Figure 3.
Tilted mitotic spindles and increased microtubule plus-end growth rates are observed in Kv10.1-deficient HeLa cells. (A–C) Hela cells were transiently transfected with either Scr- or KCNH1-siRNA and synchronized at the metaphase with consecutive thymidine and nocodazole treatments. (A) Maximal intensity projections of z-stacks (0.2 µm step size) of cells in metaphase are represented (scale bar, 50 µm) where the mitotic spindle is in green (α-tubulin), centrosomes—in red (γ-tubulin), and DNA—in blue (Hoechst 33342). The mitotic spindle angle was defined using the Imaris software as shown in the zoomed-in inset and schematically explained in (B). (C) The results of the mitotic spindle angle measurement are plotted (>50 events per experiment, n = 5 independent synchronization experiments; Mann–Whitney U-test, min to max range with the median indicated as a line are shown). (D–E) HeLa cells were transfected with respective siRNAs, grown until 70% confluency, treated with 2.5 µM DME for 4 h. The monopolar spindles were visualized with α-tubulin staining (green), and chromosomes with CENP-B (kinetochores, red) and DNA (Hoechst 33342, blue). (D) Example images of monopolar spindles are presented. (E) The percentage of asymmetric monopolar spindles is plotted (1500 monopolar spindles per condition per experiment, n = 3 independent synchronization experiments; Mann–Whitney U-test; min to max range with the median indicated as a line are shown). (F–I; Videos S1–S4) HeLa cells were transiently co-transfected with pEB3-tdTomato and the indicated siRNAs (panel in light blue) or plasmid DNAs (panel in light green); 48 h later treated with 2.5 µM DME for 4 h. Microtubule growth was tracked in a series of images taken every 500 ms for 1 min. (F) Maximal intensity projections of time-lapse images over the recorded time are shown (“Red Fire” LUT is applied, scale bar, 10 µm). (G–I) Parameters calculated by the U-Track software are plotted (>25 cells per condition per experiment, n = 3 independent synchronization experiments; Mann–Whitney U-test, min to max range with the median indicated as a line are shown). (DME—dimethylenastron; LUT—look-up table; pEB3-tdTomato—a plasmid expressing end-binding protein 3 tandem dimer tomato fluorescent protein).

