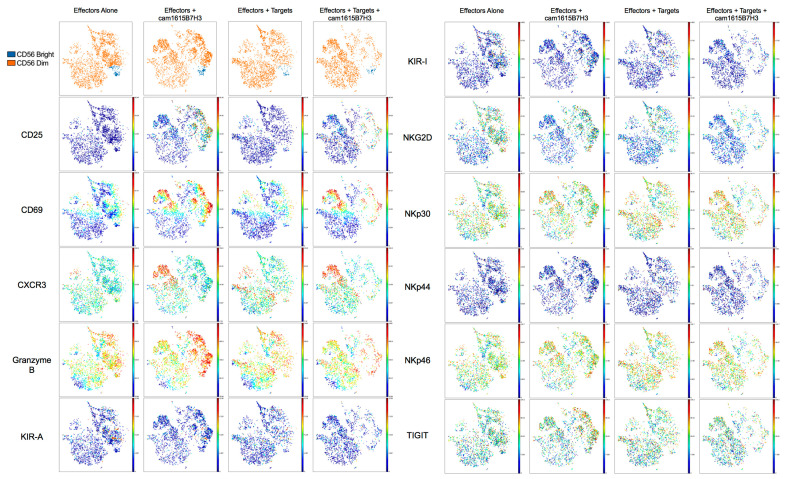
Figure 6.
High dimensional analysis of cam1615B7H3 activated NK cells. Concatenated analysis of three donors PBMCs incubated alone, with 30 nM cam1615B7H3 TriKE, with OVCAR8 tumor (2:1 E:T), or with 30 nM cam1615B7H3 TriKE and OVCAR8 tumor. Data was visualized in viSNE (Cytobank) and gated on CD45+CD56+CD3− cells. With the exception of the CD56 plot, color represents protein intensity (red = highest, and dark blue = lowest).

