
Figure 2.
Characterization of OA crystalline features of OA-CaF2 and OP-CaF2 NCs. (a, b) HR-TEM image (scale bar 10 nm, in inset 5 nm) of (a) OA-CaF2 and (b) OP-CaF2 NCs. (c, d) Powder XRD patterns of dry samples of (c) OA-CaF2 and (d) OP-CaF2 NCs.
Official websites use .gov
A
.gov website belongs to an official
government organization in the United States.
Secure .gov websites use HTTPS
A lock (
) or https:// means you've safely
connected to the .gov website. Share sensitive
information only on official, secure websites.
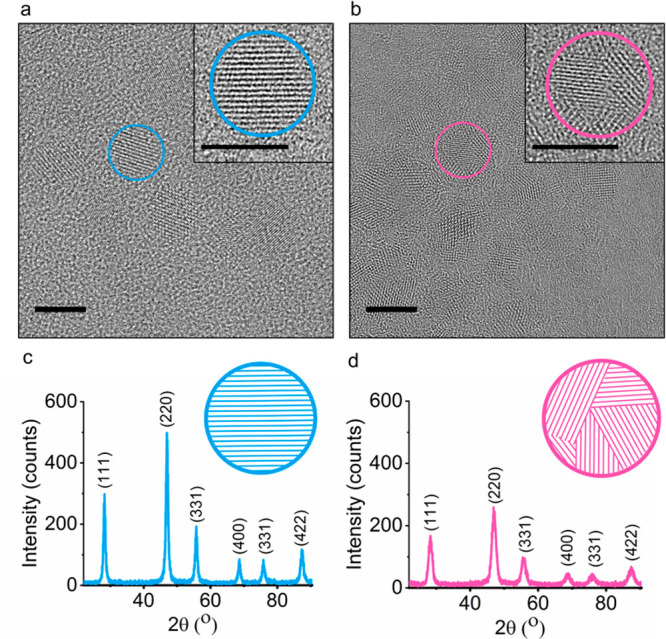
Characterization of OA crystalline features of OA-CaF2 and OP-CaF2 NCs. (a, b) HR-TEM image (scale bar 10 nm, in inset 5 nm) of (a) OA-CaF2 and (b) OP-CaF2 NCs. (c, d) Powder XRD patterns of dry samples of (c) OA-CaF2 and (d) OP-CaF2 NCs.