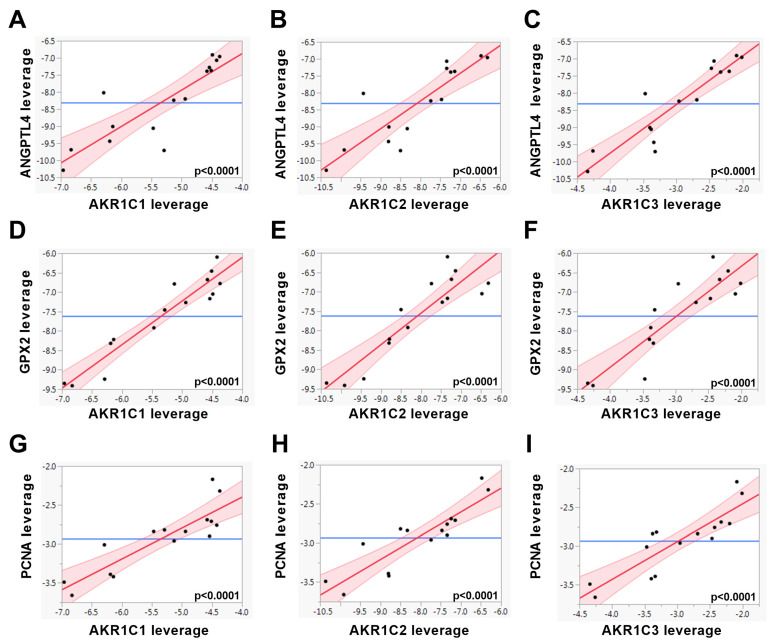
Figure 4.
The gene expression levels of AKR1C1, AKR1C2, and AKR1C3 were associated with the genes indicated using multiple linear regression models in 5.5, 11.25, and 17.5 mM glucose-treated PC3 cells (n = 15) and are shown as leverage plots. Statistical significance was considered as p < 0.05. The p-values are indicated in the figure.

