Figure 1.
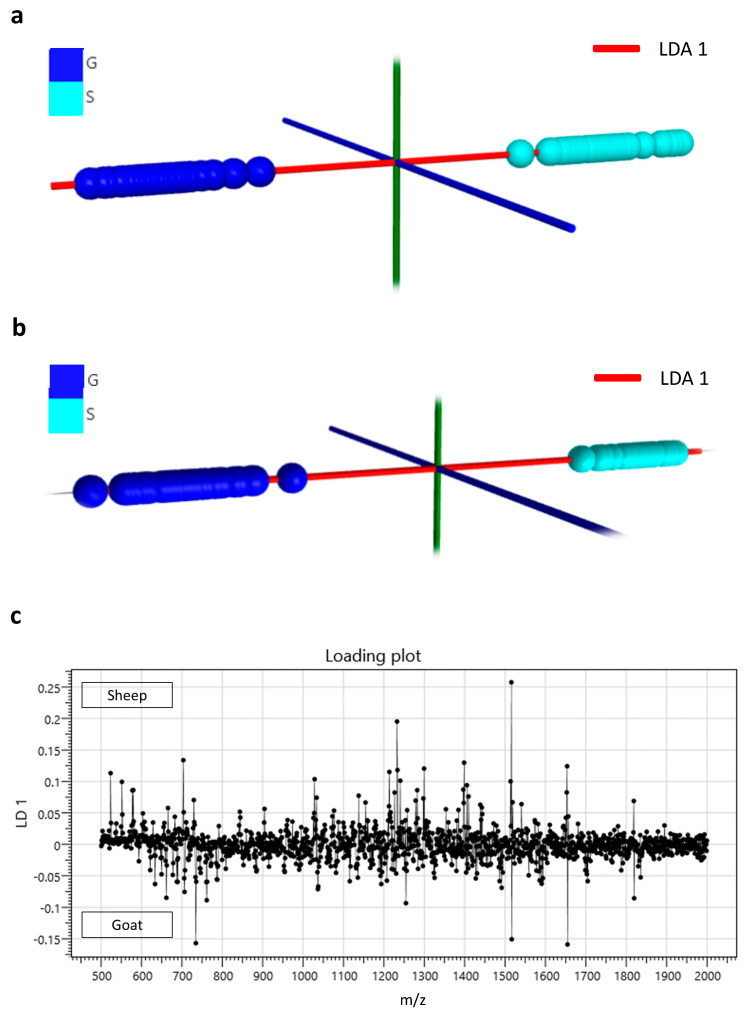
(a) Linear discriminant analysis plot obtained from solid-state matrix-assisted laser desorption/ionisation (MALDI) MS profiling data of the lipids extracted from goat (G) and sheep (S) milk samples. (b) Linear discriminant analysis plot obtained from liquid atmospheric pressure (AP)-MALDI MS profiling data of both lipids and proteins from goat (G) and sheep (S) milk samples. (c) Loading plot of the linear discriminant analysis of the data obtained by liquid AP-MALDI for the classification of goat and sheep milk samples shown in (b).

