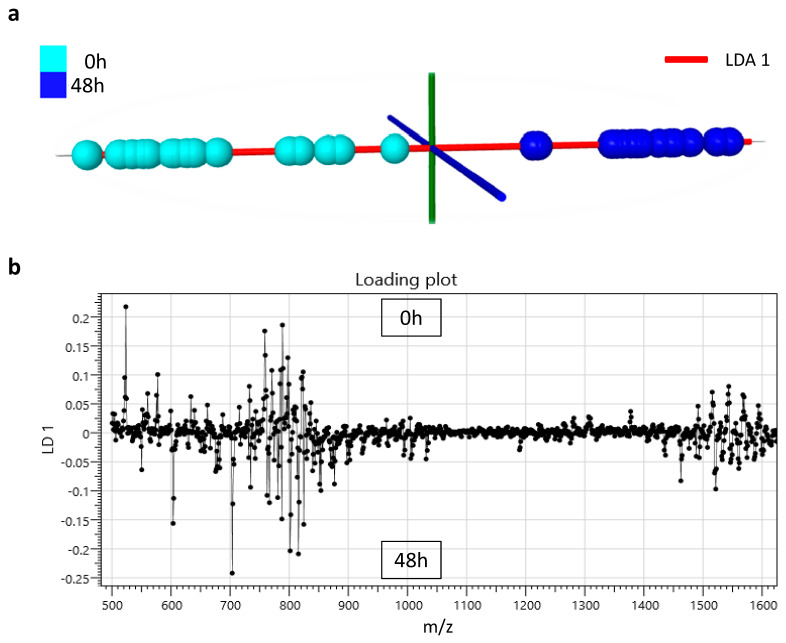
Figure 4.
(a) Linear discriminant analysis plot obtained from conventional (solid-state) MALDI MS profiling data of Sarda sheep colostrum samples collected at time 0 h (light blue) and 48 h (grey) later. (b) Loading plot of the linear discriminant analysis of the data obtained by conventional (solid-state) MALDI for the classification of Sarda sheep colostrum samples collected at time 0 h and 48 h later.

