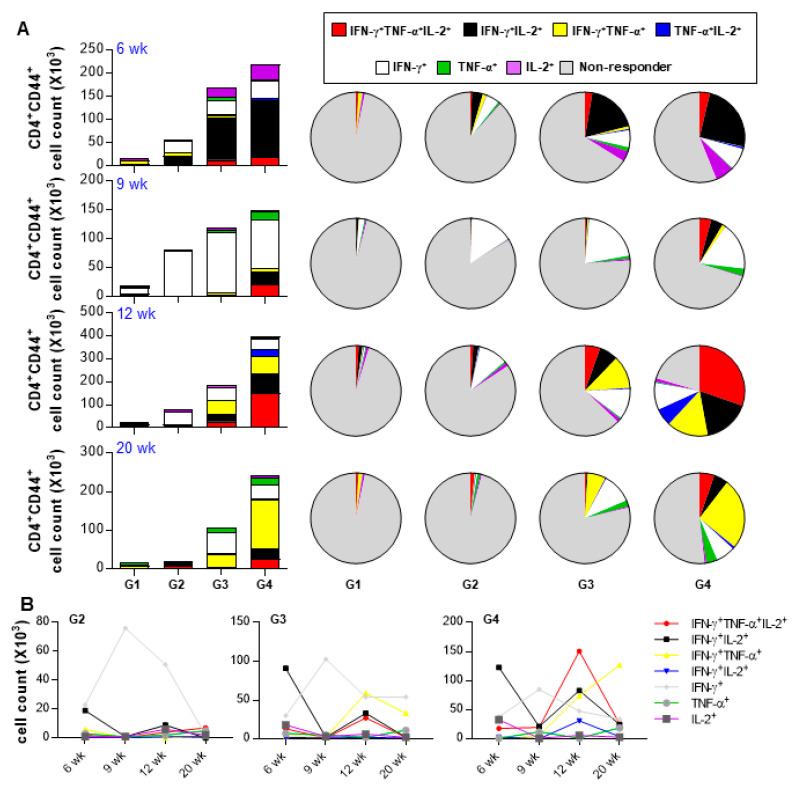
Figure 6.
Analysis of polyfunctional cytokine production by Rv2882c-Rv2005c-specific CD4+ T cells in infected lungs after treatment. The percentages of activated multifunctional CD4+CD44+CD62− T cells in the drug- and drug plus Rv2882c-Rv2005c-treated groups were evaluated at different time points during the course of therapy. The percentage of the respective cells in the infected control group is shown in the inset of the bar diagram. G1 = naïve G2 = Infection only G3 = Chemotherapy + adjuvant G4 = Chemotherapy + Rv2882c-Rv2005c / adjuvant. Data are expressed as (A) Pie chart, (B) Linear graph.

