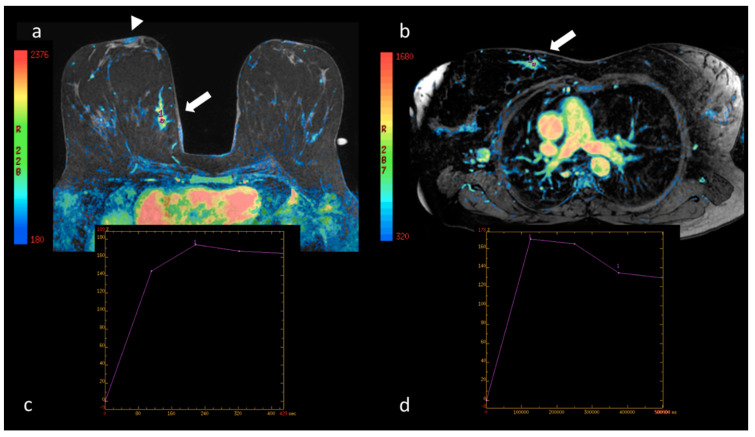
Figure 6.
(a) Native image of the first dynamic sequence performed in the prone position superimposed with the colorimetric map showing maximum contrast impregnation (see the reference side bar) in the nipple area (arrowhead). At the confluence of the internal quadrants of the right breast, the site of the neoplasia described in Figure 4, the distribution of the contrast medium is shown (arrow); in the area of maximum impregnation a region of interest (ROI) has been drawn marked by the number 1. The corresponding percentage/time intensity curve (au/sec) is shown in (c). (b) Native image of the first dynamic sequence performed in the supine position superimposed with the colorimetric map. In this position, the dynamic curve of the breast lesion was evaluated in a ROI marked by the number 1. The corresponding percentage/time intensity curve (au/sec) is shown in (d). In both positions the curve is a type III with the same maximum peak values in the early phase; in (d) the late-phase wash-out appears more accentuated.

