
FIGURE 5.
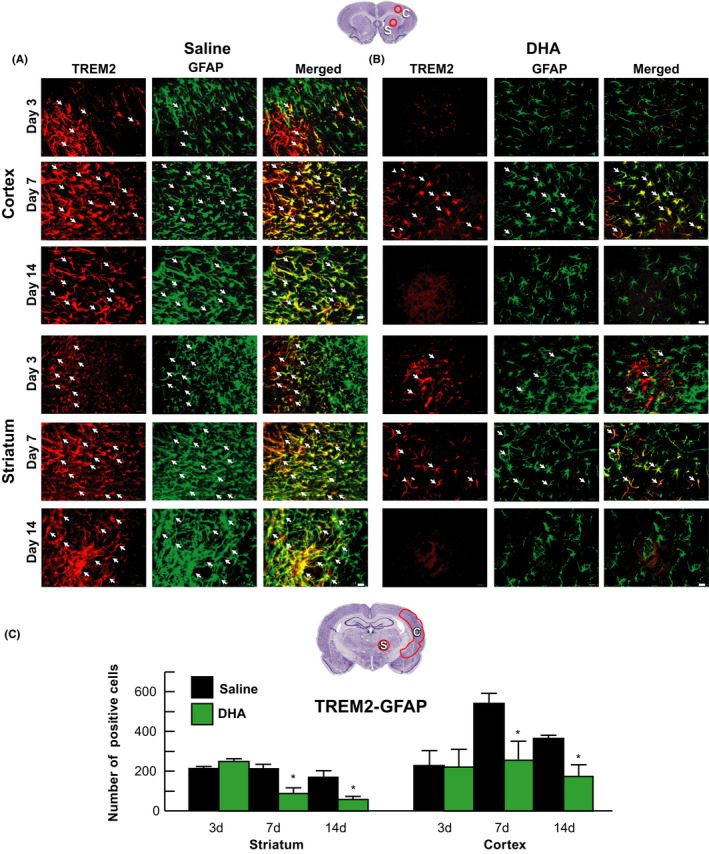
DHA suppressed TREM2 expression in reactive astrocytes after MCAo. Representative images of TREM2+ (red) and GFAP+ (green) staining in the cortex and striatum on days 3, 7, and 14. Arrows indicate colocalized TRME2/GFAP‐positive cells. Series of images were obtained from peri‐cortical and striatal infarct areas at bregma level + 1.2 mm. Scale bar = 20 µm