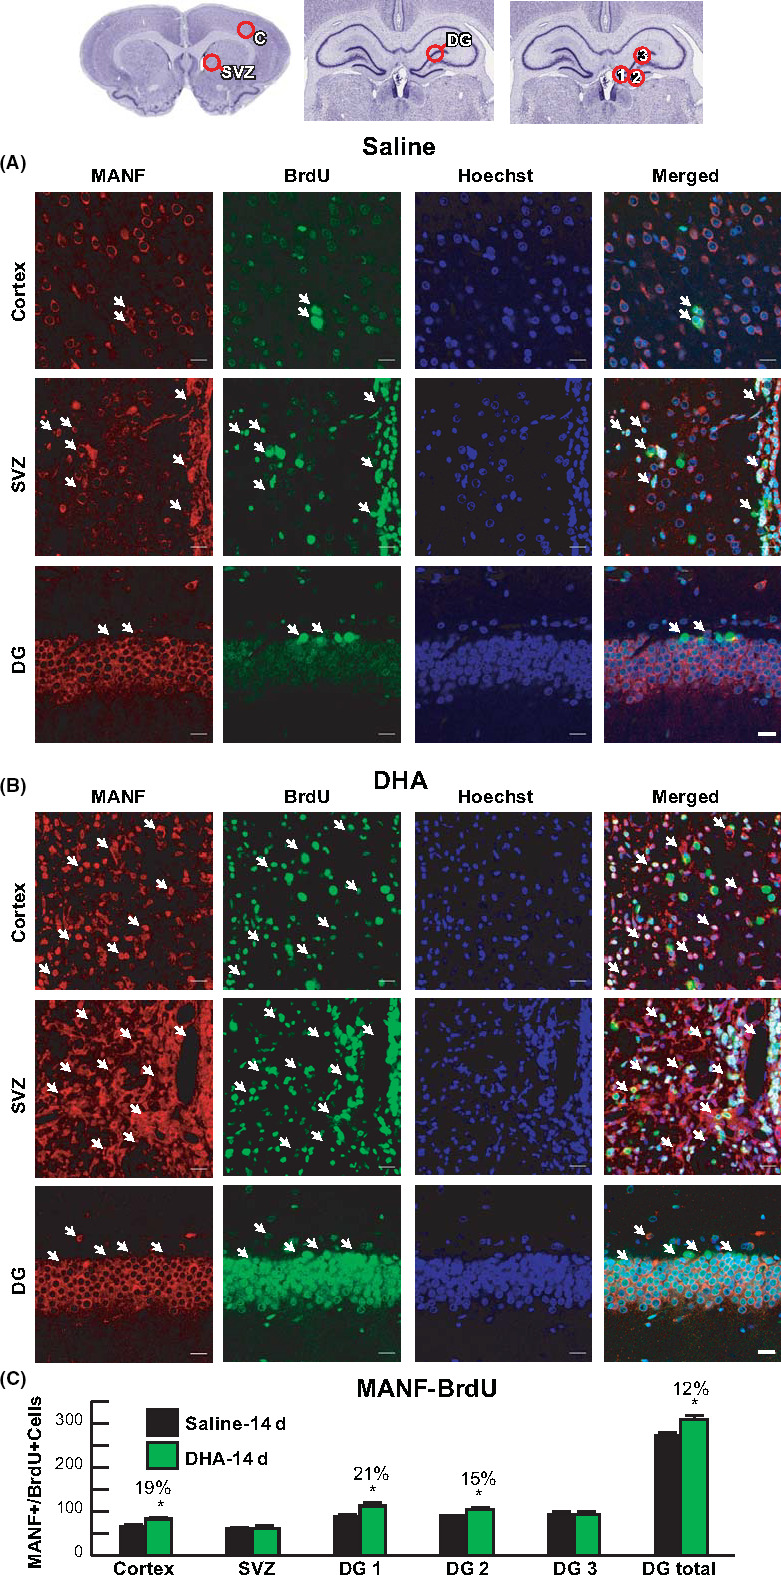
FIGURE 6.

DHA enhances MANF expression and neurogenesis 2 weeks after MCAo. A, Diagram of location for the cell count in cortex, SVZ, and three regions of DG (1: DG crest, 2: infrapyramidal DG, 3: suprapyramidal DG). Representative images of MANF+ (red), BrdU+ (green), and Hoechst+ (blue) cells in peri‐infarct cortex, SVZ, and DG from saline (A) and (B) DHA‐treated rats. Arrows indicate MANF/BrdU double positive cells. Quantification of double‐labeling MANF‐BrdU (C). n = 5‐6/group; *P < .05, DHA vs saline; and repeated‐measures ANOVA followed by Bonferroni tests. Images were acquired from cortex and SVZ at bregma level + 1.2mm and DG at bregma level 3.8 mm. Scale bar = 20 µm. Peri‐infarct cortex (C); subventricular zone (SVZ); and dentate gyrus (DG)
