Figure 1.

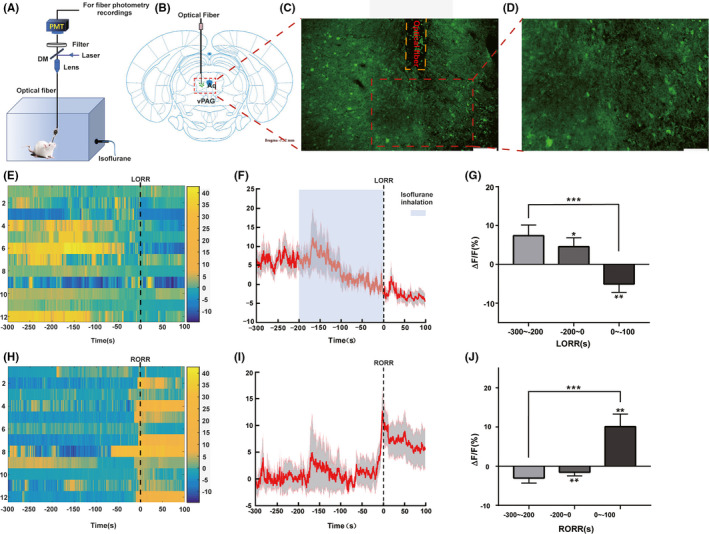
Phase‐dependent calcium alterations in ventral periaqueductal gray (vPAG) neurons during isoflurane anesthesia. A, Diagram of experimental setup for in vivo calcium signal recordings. B, Schematic of the AAV‐hSyn‐GcaMP virus’ site, modified from the Rat Brain Atlas. Aq = Aqueduct. C, Histological immunohistochemical photograph showing the AAV‐hSyn‐GcaMP virus vector and fiber injecting sites in the vPAG. (scale bar = 200μm). D, Higher magnification photograph of (C) (scale bar = 100μm). E, Fluorescence calcium signals aligned to isoflurane‐induced loss of righting reflex (LORR). F, Mean (red trace) ± SEM (gray shading) indicating the average calcium transients during isoflurane‐induced LORR (n = 12). G, The fluorescence calcium signals sharply decreased after infusion of isoflurane. H, Fluorescence calcium signals corresponded to isoflurane‐induced recovery of righting reflex (RORR). I, Mean (red trace) ± SEM (gray shading) showing the transients of average calcium signals during isoflurane‐induced RORR (n = 12). J, The fluorescence calcium signals sharply increased during transition from isoflurane‐induced anesthesia to arousal (*P < .05; **P < .01; ***P < .0001)
