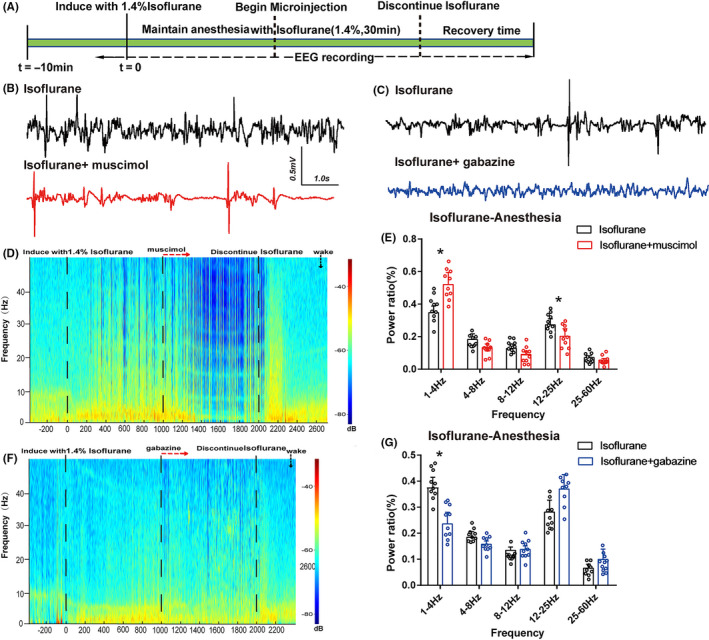
Figure 5.

Power spectral analysis of cortical EEG before and after muscimol or gabazine during isoflurane anesthesia. (A) Timeline for EEG recording in microinjection experiments. (B)The representative example of EEG activity waveforms and corresponding EEG power recorded in the PFC before and after infusion of (B, D) muscimol or (C, F) gabazine during isoflurane anesthesia. (E) Activation of muscimol in the vPAG augmented δ band (1‐4 Hz) and suppressed the power ratio in the β band (12‐25Hz) during isoflurane anesthesia. (G) In contrast, blockade of GABAAR decreased the δ band during isoflurane anesthesia. Data from spectral analyses of EEG power are presented as mean ± SD (n = 10). *P < .05
