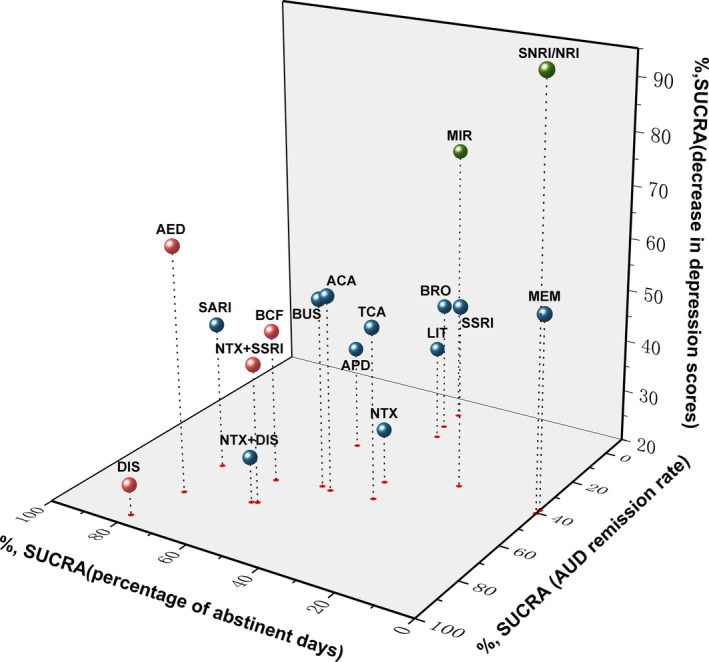
FIGURE 6.

Three‐dimension scatters plot for SUCRA value for three different parameter outcomes. The more a SUCRA value approached to 100%, the better the corresponding intervention is in efficacy. Red colored represented an intervention was significantly more efficacious in the treatment of alcohol‐related symptoms compared to controls. Green colored represented an intervention was significantly more efficacious in reducing the scores of depression scales. ACA, acamprosate; AED, antiepileptics; APD, antipsychotics; BCF, baclofen; BUS, buspirone; BRO, bromocriptine; DIS, disulfiram; LIT, lithium; MEM, memantine; MIR, mirtazapine; NRI, noradrenaline reuptake inhibitor; NTX, naltrexone; SARI, serotonin receptor antagonist/reuptake inhibitor; SSRI, selective serotonin reuptake inhibitor; TCA, tricyclic antidepressants
