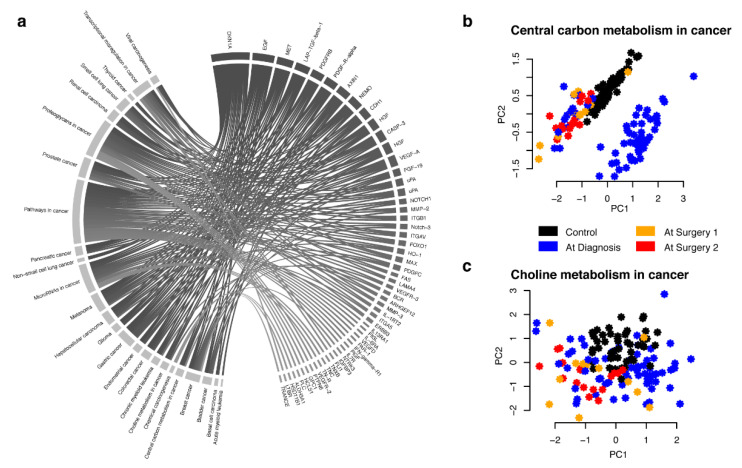
Figure 2.
(a) KEGG pathways in cancer including genes that code for proteins that have significantly deviating levels between samples collected at diagnosis (awake patients) or at surgery (sedated patients). Pathways are show to the left and proteins to the right. (b) Principle component analysis (PCA) of NPX values for proteins with significantly deviating levels between samples collected at diagnosis or at surgery with encoding genes listed in the KEGG pathway “Central carbon metabolism in cancer” (hsa05230). Black dots correspond to healthy female controls, orange and red correspond to samples collected at time of surgery from patients diagnosed with ovarian cancer and blue dots to samples collected at time of diagnosis from patients diagnosed with ovarian cancer. (c) as (b) but for “Choline metabolism in cancer” (hsa05231).

