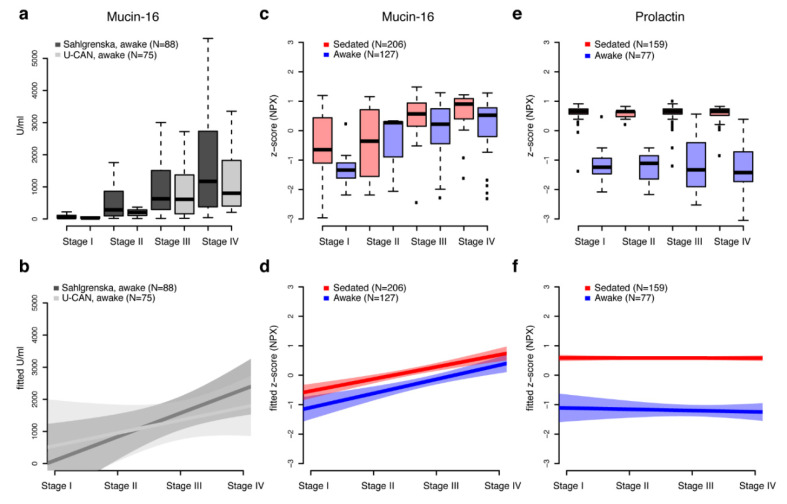
Figure 3.
(a) Preoperative clinical measurements of Mucin-16 (CA-125) for two sets of awake patient cohorts from the two biobanks, Sahlgrenska (dark grey) and U-CAN (light grey). Measurements are given in U/mL and stratified on ovarian cancer stage (I–IV). Outliers were omitted from the boxplot. The top and the bottom of the box represents the 25th and 75th percentile and the band inside the box the median value. (b) Linear regression models (thick lines) and 95% confidence intervals (shaded area) for preoperative measurements of Mucin-16 as function of ovarian cancer stage. (c) Comparisons of z-scaled PEA measurements (NPX) of Mucin-16 in sedated and wake patients stratified by ovarian cancer stage. The top and the bottom of the box represents the 25th and 75th percentile and the band inside the box the median value. (d) Linear regression models (thick lines) and 95% confidence intervals (shaded area) for z-scaled PEA measurements of Mucin-16 in sedated and wake patients as function of ovarian cancer stage. (e,f) as (c,d) but for Prolactin.

