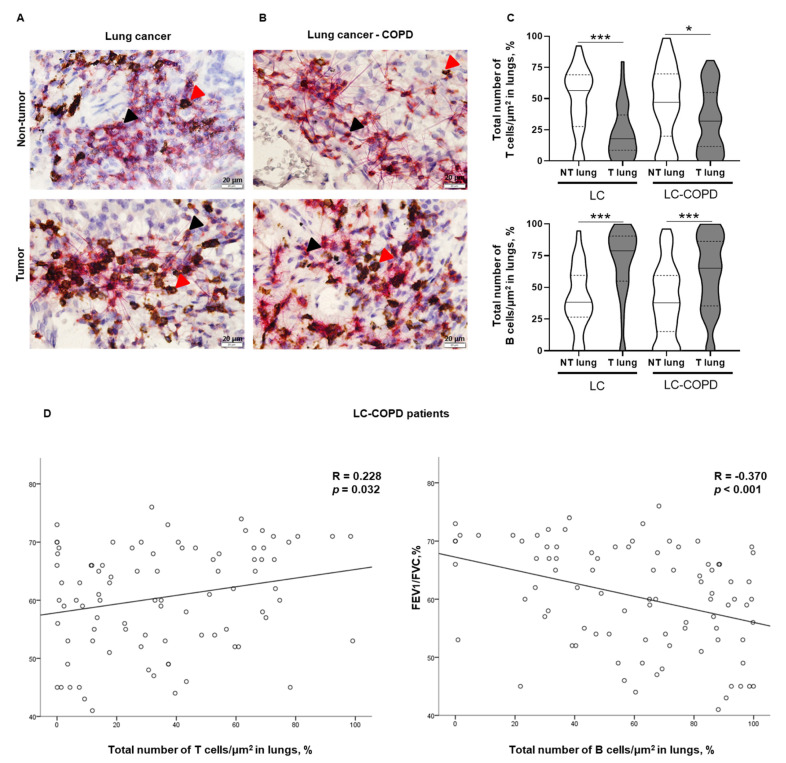
Figure 2.
T and B cell counts in tumor and non-tumor lungs of patients and their correlations with lung function parameters. (A,B) Representative double immunohistochemical staining sections of T and B cells in non-tumor and tumor lung specimens of LC and LC-COPD patients, respectively. T cells (CD3+) indicated by black arrows were stained in red color, and B cells (CD20+) indicated by red arrows were stained in brown color, respectively. (C) Violin plot with median (continuous line) and interquartile range (discontinuous line) of the number of T cells (top panel) and B cells (bottom panel) as indicated by the percentage of T and B cells in the total measured area respectively. Black stained regions within the lungs correspond to anthracosis. (D) Statistically significant correlations between FEV1/FVC and T cell numbers (positive), and B cell numbers (inverse) in LC-COPD patients. Definition of abbreviations: LC, lung cancer; COPD, chronic obstructive pulmonary disease; CD, cluster of differentiation; FEV1, forced expiratory volume in one second; FVC, forced vital capacity. Statistical significance: ***, p ≤ 0.001, * p < 0.05 between tumor and non-tumor samples in both study groups.

