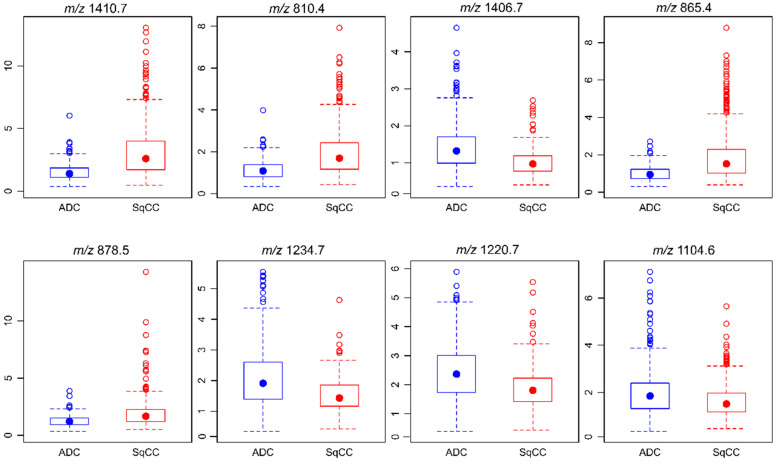
Figure 2.
Intensity of m/z values contributing to the classification model regarding the entity. The eight m/z values that contribute most to the random forest model classification of ADC and SqCC are shown. Peak intensities are presented as box plots with regard to the entity. In particular, the median demonstrates the differences in m/z values between the two entities.

