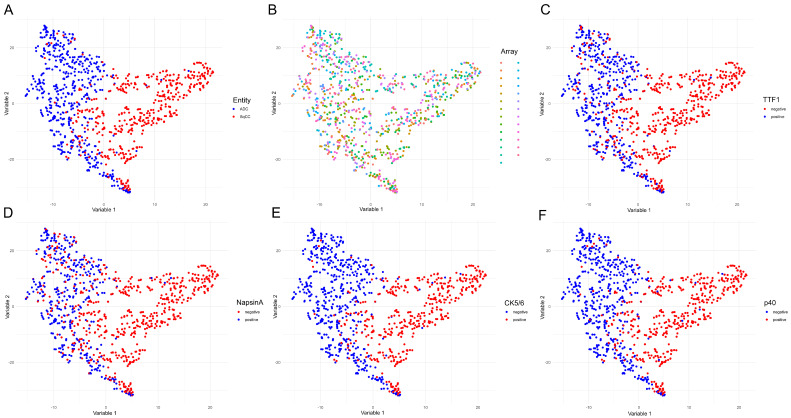
Figure 3.
T-distributed stochastic neighbor embedding analysis reveals the plausibility of adenocarcinoma and squamous cell carcinoma classification based on the selected m/z values. T-distributed stochastic neighbor embedding analysis was performed including the eight previously selected m/z peaks (m/z 1410.7, 810.4, 1406.7, 865.4, 878.5, 1234.7, 1220.7, and 1104.6). Each dot represents a single case. The data are presented with regard to tumor entity (A); analyzed TMA (each color represents a TMA (tissue microarray), with 24 TMAs total (B); TTF1 (thyroid transcription factor 1) (C); Napsin-A (D); CK5/6 (cytokeratin 5/6) (E); and p40 (F).

