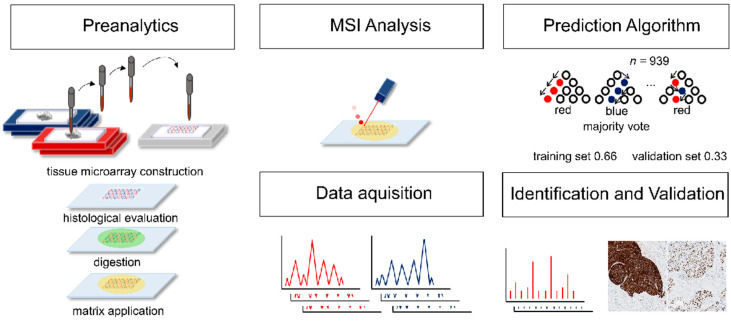
Figure 4.
Workflow of mass spectrometry imaging analysis and data evaluation. Tissue microarrays were constructed and analyzed by mass spectrometry imaging. Samples were randomly assigned to a training set (66% of samples) and a test set (33% of samples). A prediction algorithm was created on the training set and validated on the test set. After data evaluation, the most important m/z values were identified by tandem mass spectrometry and validated using immunohistochemistry.

