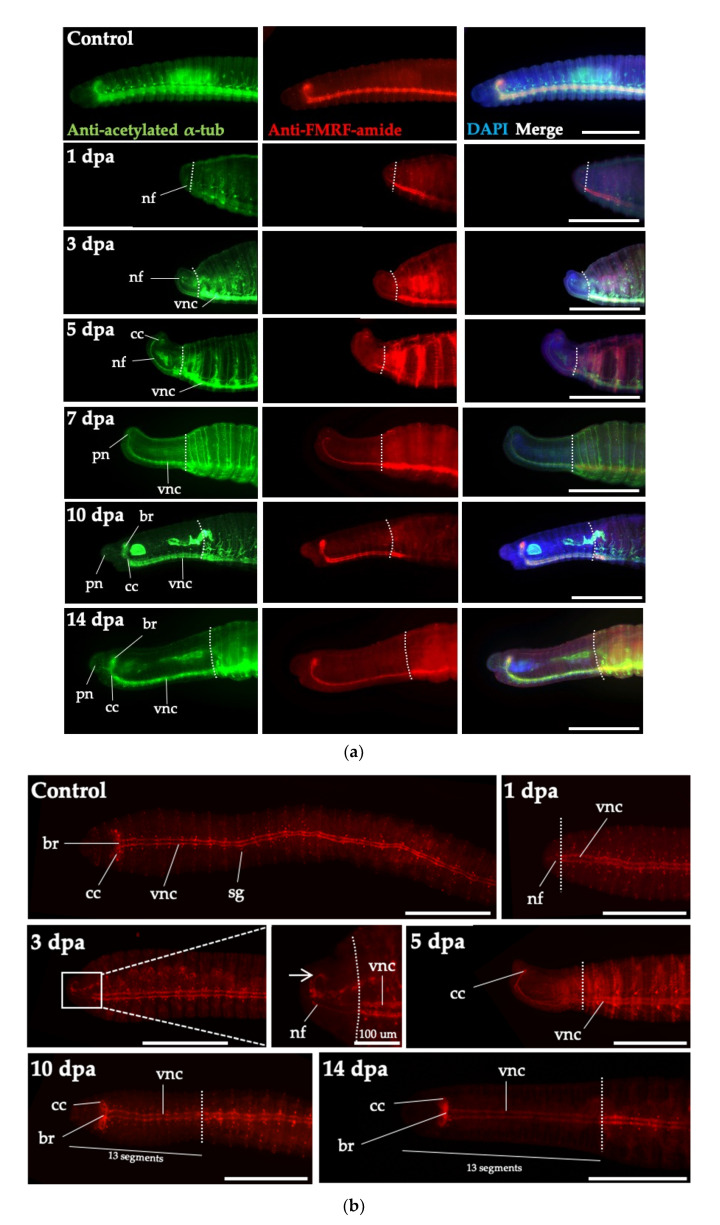
Figure 6.
Visualization of nervous system regeneration. (a) The nervous system regeneration in the head region of P. excavatus was visualized using anti-acetylated α-tubulin staining (green) and anti-FMRF-amide staining (red) at indicated dpa. Nuclei are marked by DAPI staining (blue). Dotted lines represent the position of amputation. At 1 dpa, the wound at the amputated site is healed. The nervous system regenerates and nerve connections from the brain to the ventral nerve cord are clearly visualized. Regenerative tissues are shown in lateral view, with the dorsal side on the top. Scale bar, 500 μm. (b) The process of nervous system regeneration in the head region of P. excavatus was visualized using anti FMRF-amide staining (red). At 3 dpa, the white arrow indicates the loop of circumesophageal connectives. Regenerative tissues are shown in ventral view. Abbreviations: br, brain; cc, circumesophageal connective; nf, nerve fibers; pn, palp nerves; sg, segmental ganglia; vnc, ventral nerve cord. Scale bar, 500 μm.

