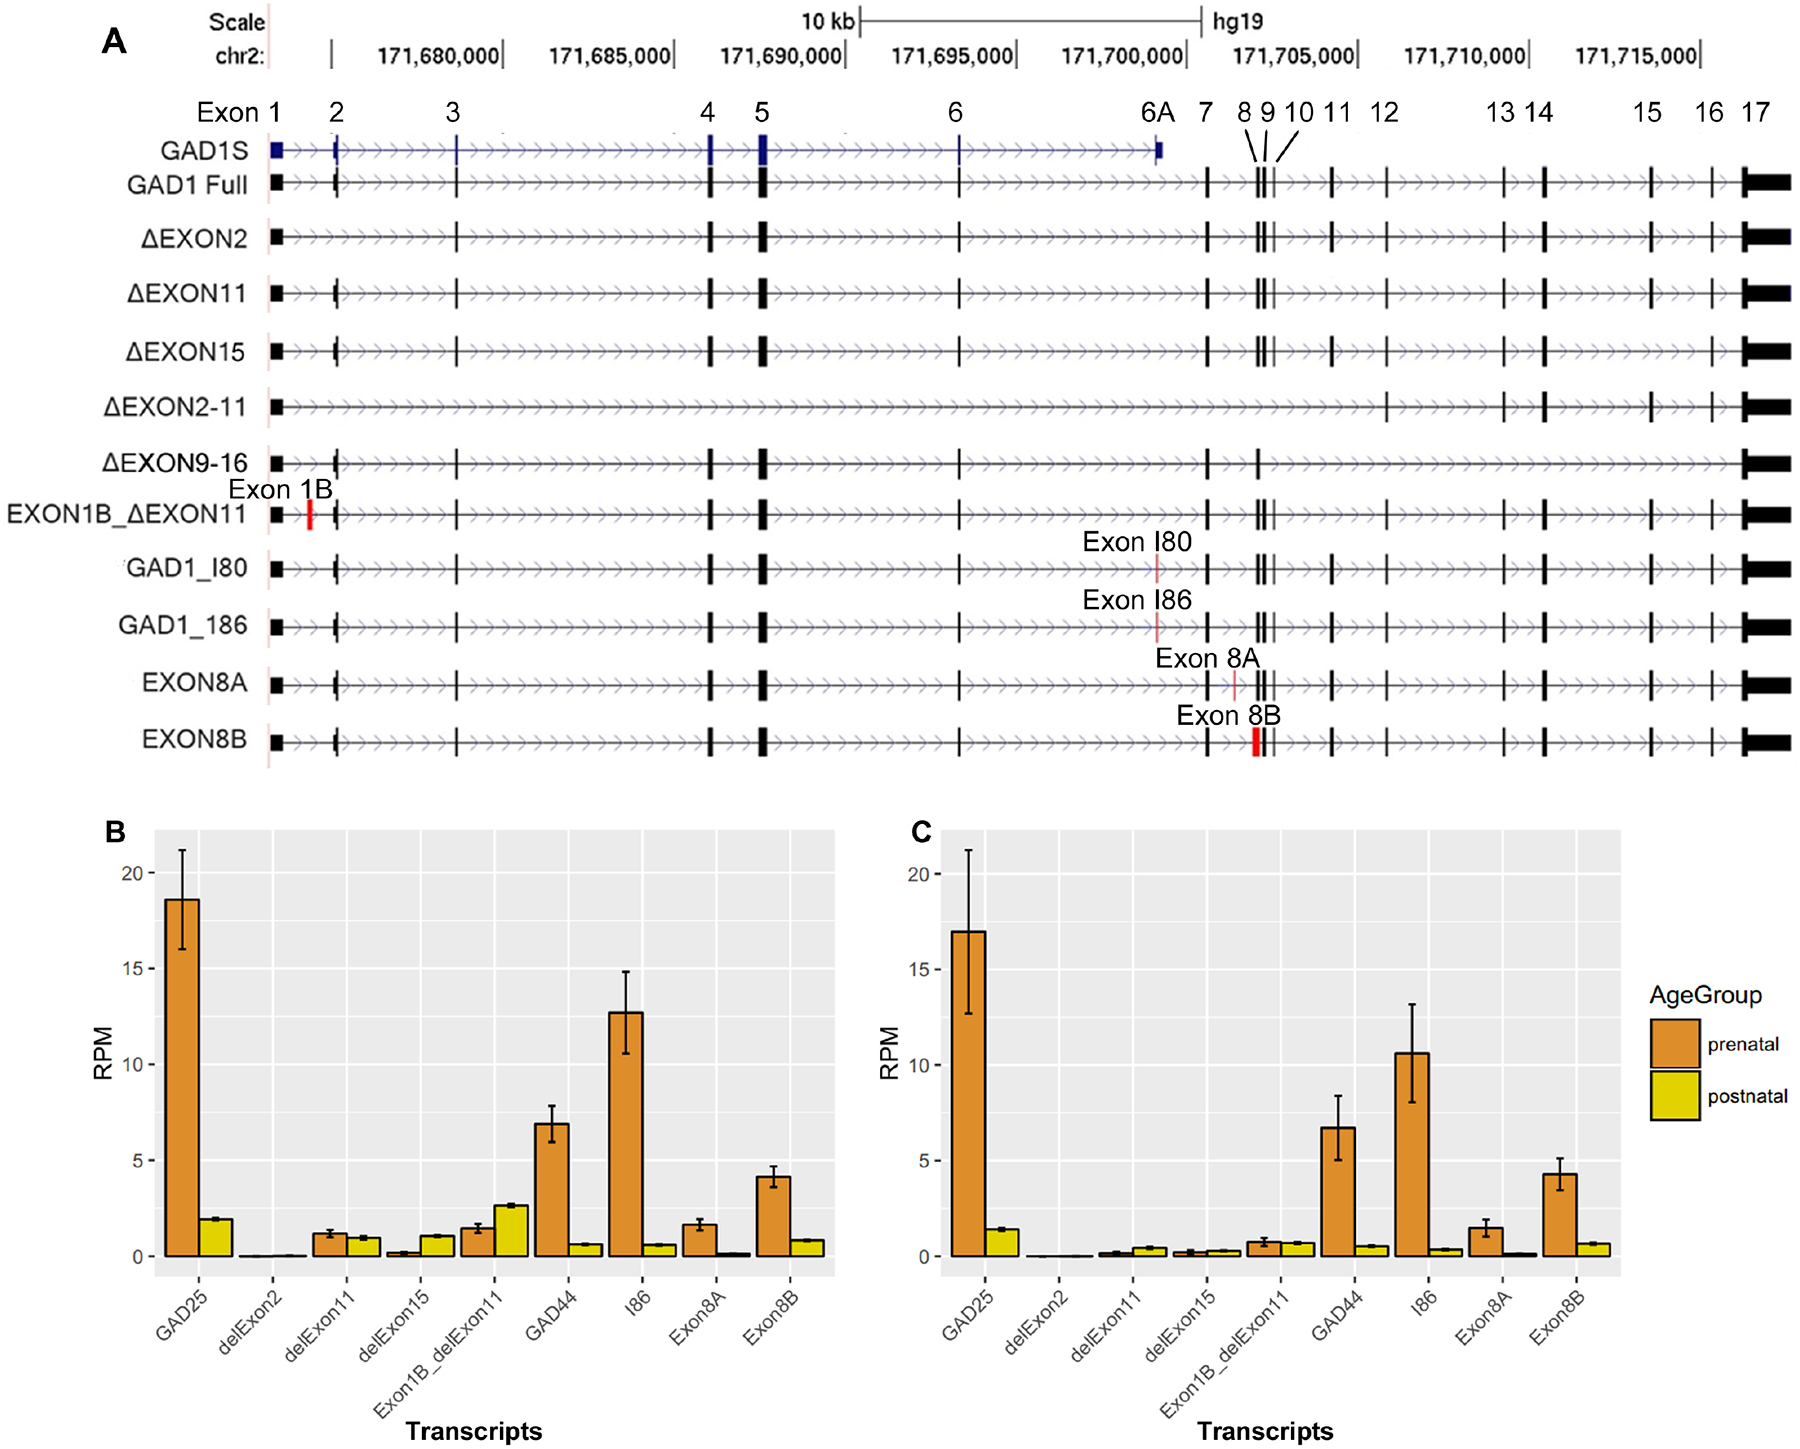
Figure 1. Identification and mRNA expression of alternative transcripts of GAD1 in human brain.

A: Alternative transcripts of GAD1 in human brain. We have observed five exotic deletions and 3 novel exons in both adult and fetal human brain. We have also observed the expression of the two embryonic exons in human brain: I80 and I86, previously discovered in rodent brain. In total, we have identified 8 novel GAD1 transcripts in human brain and confirmed the existence of transcripts GAD1-I80 and GAD1-I86 in human brain. Red rectangles, new exons; black rectangles; known exon. Stars mark the 4 embryonic transcripts measured with real-time quantitative PCR. Exon deletion is indicated by Δ; for example, ΔEXON2 means deletion of exon2. Transcripts with a new exon were represented by its former exon name plus a letter. For example, EXON8A means a transcripts containing a new exon between original exon 8 and exon 9. Novel alternative exons have been highlighted by red color. B: mRNA expression of GAD1 transcripts in human DLPFC. C: mRNA expression of GAD1 transcripts in human Hippocampus. We have measure the average expression of GAD1 transcript in the DLPFC and Hippocampus of control subjects by using the RNA sequencing data and unique junctions of each transcript. The expression of the transcripts with novel deletion have been measured by the reads spanning the junction of the deletion. The expression of the transcript with novel exons have been measured by the reading spanning the junction between the novel exon and nearby exon. Since the I80 encodes the GAD25 and GAD44, so the expression of I80 can reflect the expression of GAD44. Since the GAD25 was encodes by I80 and I86, which sharing the same unique junction from exon 6 to I80 or I86, we have used the sharing unique junction of I80 and I86 to represent the expression level of GAD25. We didn’t show the expression level of the full length GAD1 transcript, encoding GAD67, in this two plots. It is because it expression level is too high in postnatal stage to be showed properly with other transcripts together in the same plot. The rare GAD1 transcripts such as ΔEXON2–11 and ΔEXON 9–16 were also not plotted since they are rare.
