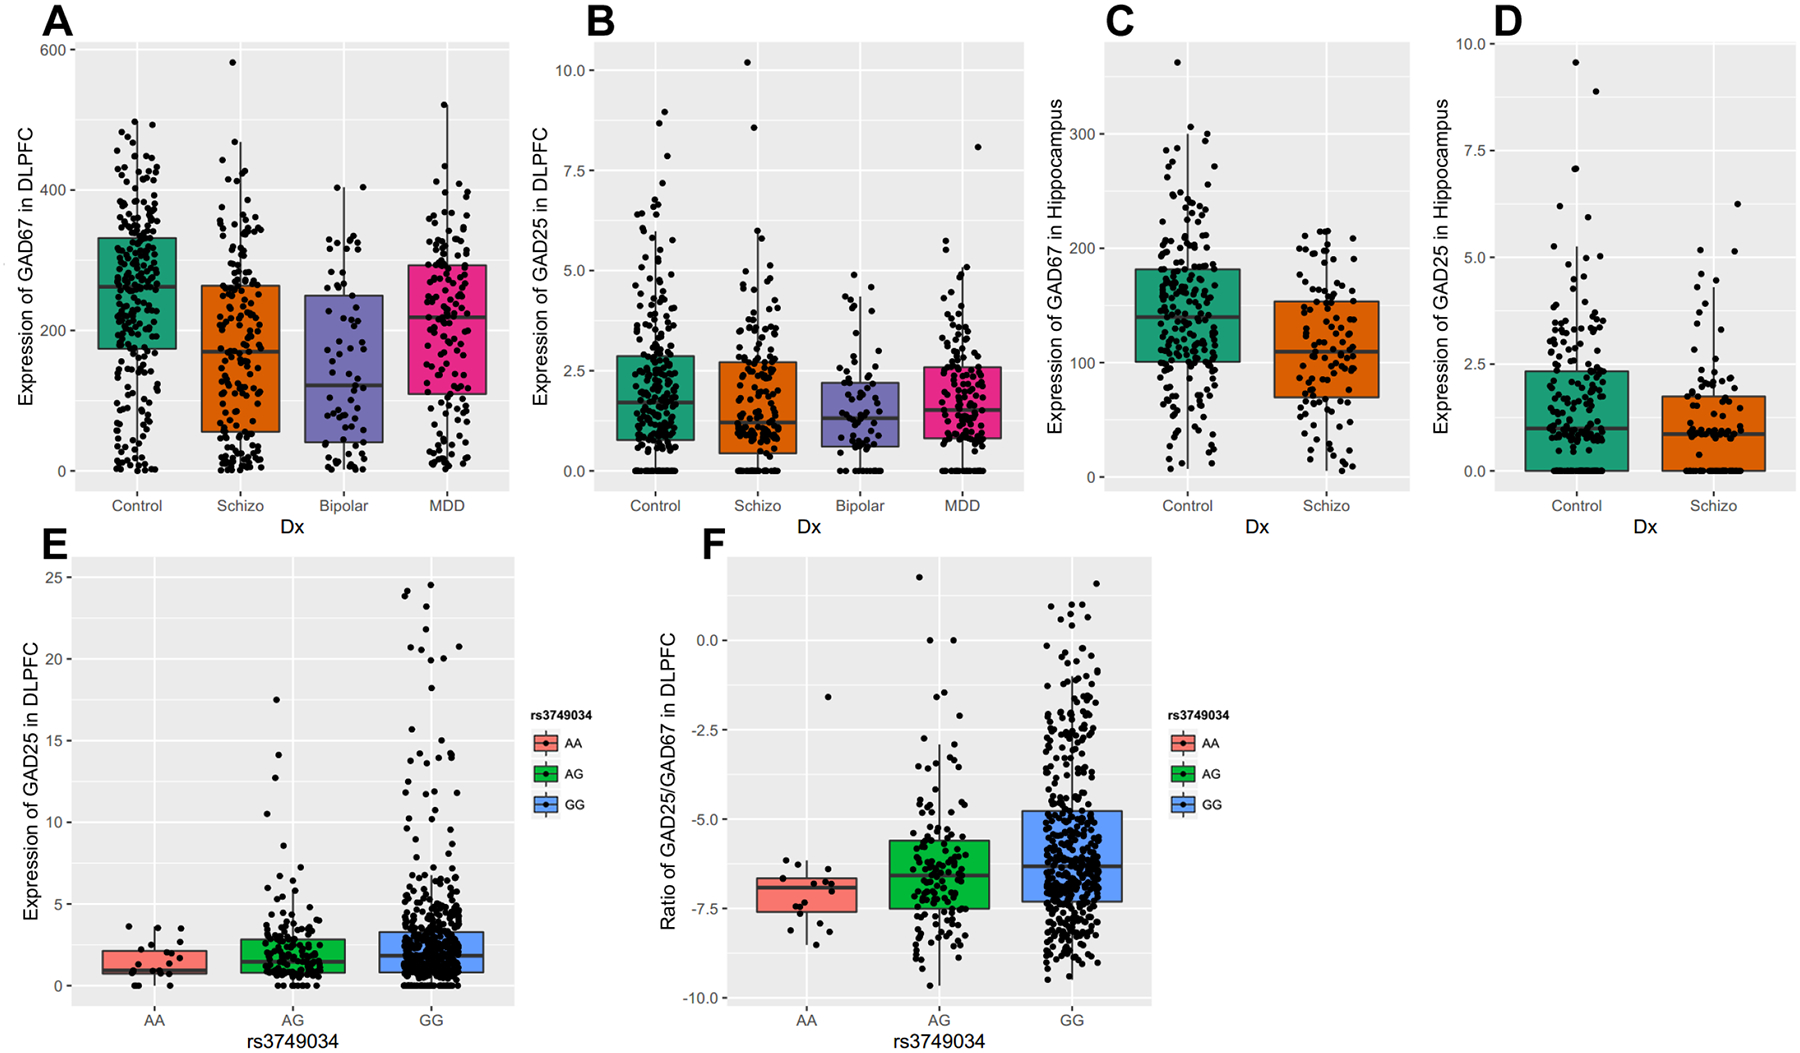
Figure 2. Expression of transcripts encoding GAD67 and GAD25 in human DLFPC and Hippocampus among different diagnostic groups.

The expression of each alternative transcript was studied across four cohorts of subjects (nonpsychiatric controls, schizophrenia, major depressive disorder, and bipolar disorder) in DLPFC and two cohorts of subjects in hippocampus (nonpsychiatric controls and schizophrenia). A: the expression of transcript encoding GAD67 in DLPFC; B: the expression of transcripts encoding GAD25 in DLPFC; C: the expression of transcript encoding GAD67 in Hippocampus; D: the expression of transcripts encoding GAD25 in Hippocampus. The x-axis shows the different diagnostic groups: Control, nonpsychiatric control group; Schizo, patients with schizophrenia; Bipolar, patients with bipolar disorder; MDD, the patient group with major depression. The y-axis represents the relative expression quantities in the DLPFC or Hippocampus. Each dot represents a subject. E: schizophrenia-associated GAD1 risk SNP rs3749034 and the expression of GAD25 in human DLPFC. F: schizophrenia-associated GAD1 risk SNP rs3749034 and ratio of GAD25/GAD67 in human DLPFC. The different genotypes are on the x-axis. The schizophrenia-associated risk genotype is G/G. The y-axis represents the expression of GAD25 in DLPFC or the ratio of the expression of transcript encoding GAD25 divided by the expression of the transcript encoding GAD67. Each dot represents a subject.
