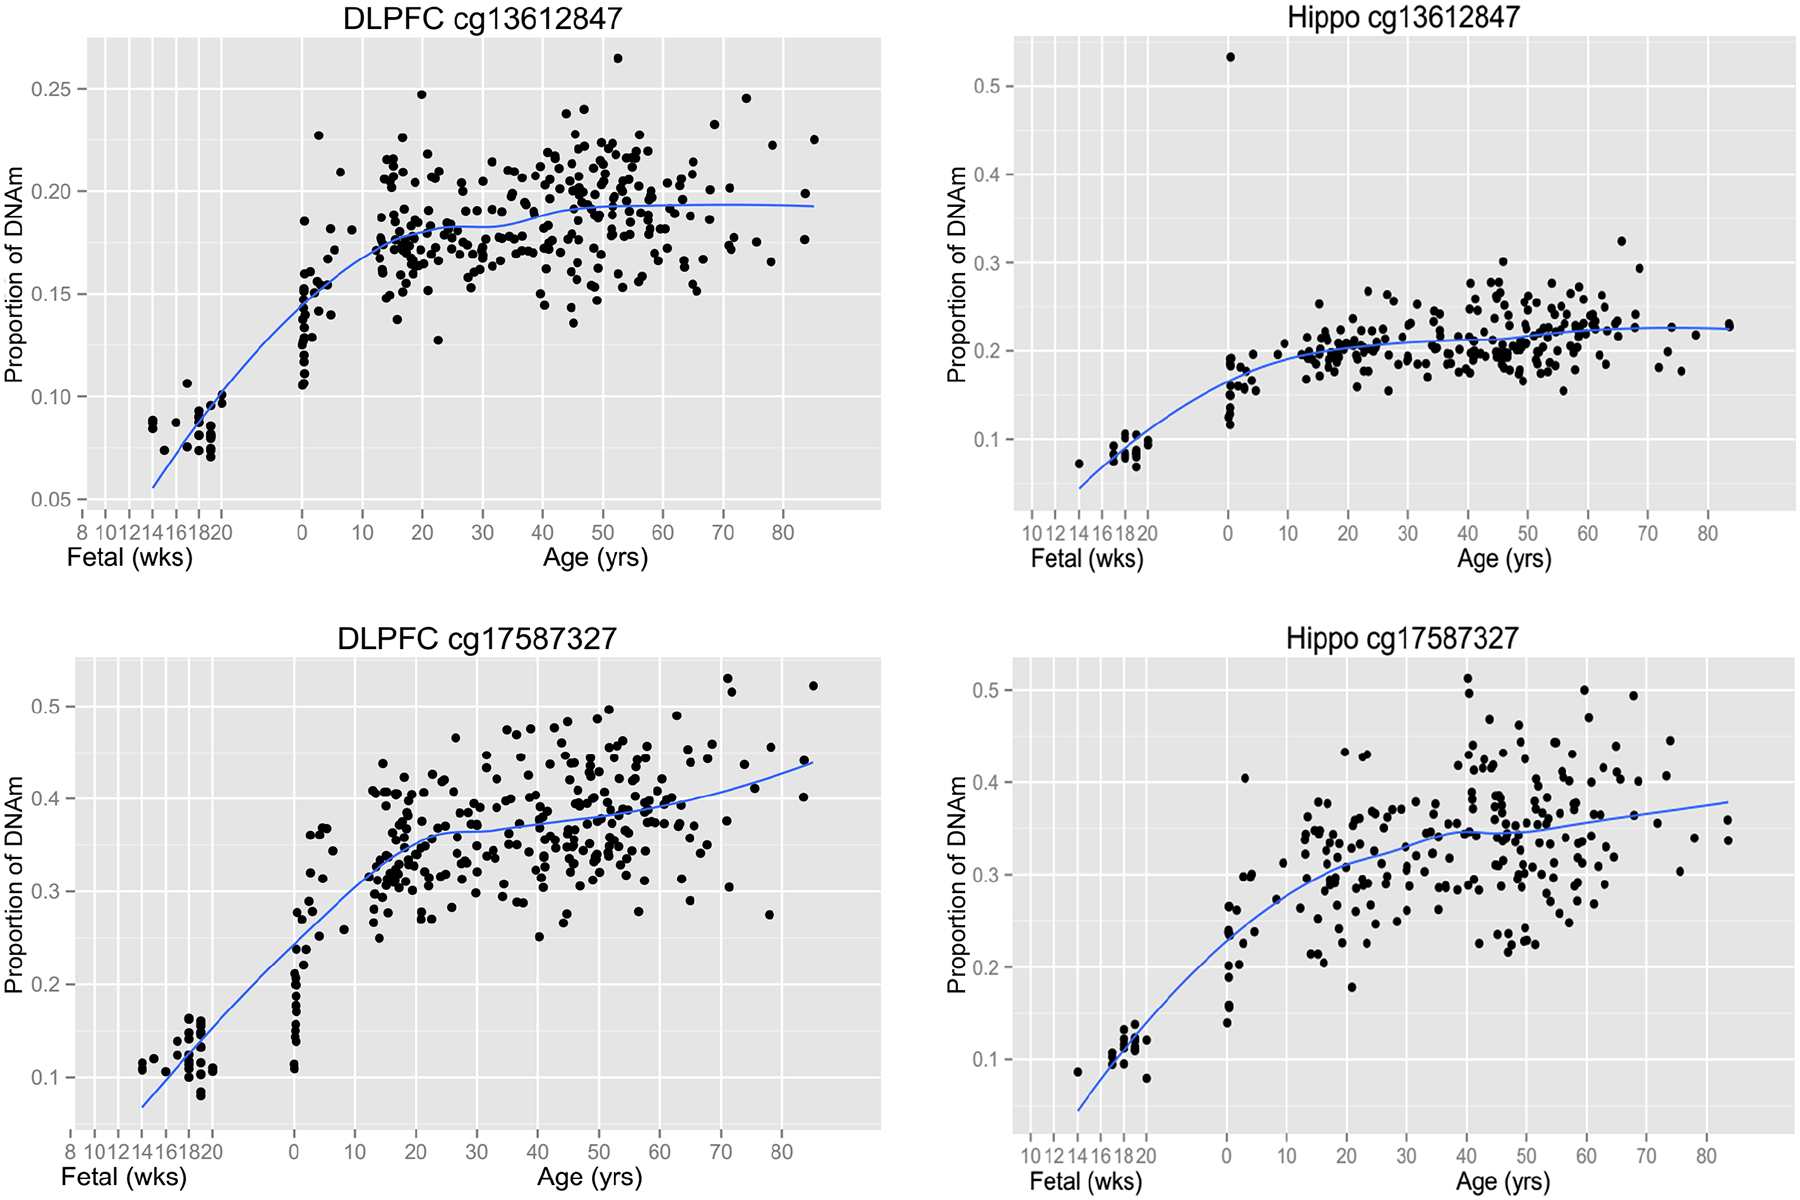
Figure 3. The lifespan trajectory of DNA methylation level at cg13612847 and cg17587327 loci in human DLPFC and Hippocampus.

Both CpG loci (cg) showed similar lifespan trajectory of DNA methylation level in human DLPFC and Hippocampus. Their methylation level is low in fetal age, and rising during the brain development until about 20~30 years old. The x-axis before birth gestational age is in weeks (wks) and after birth the x-axis shifts to years (yrs). The y-axis represents proportion of DNA methylation level at CpG locus. Each black dot represents a subject. Blue curve indicates the best fit curve for lifetime expression.
