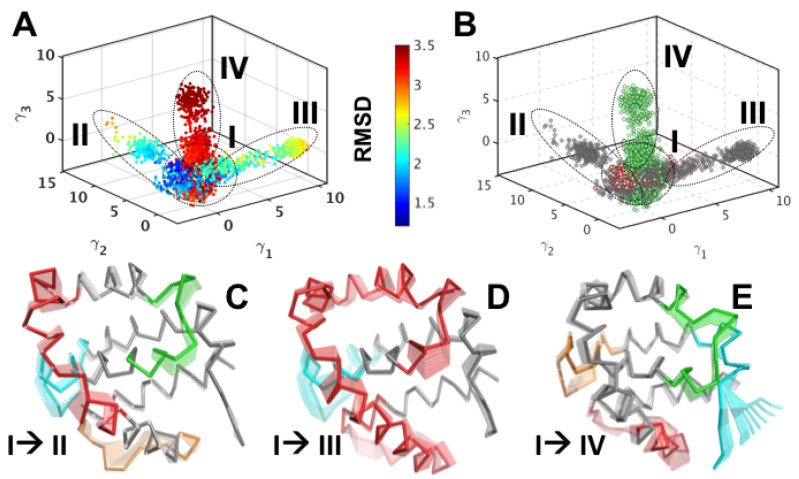
Figure 3.
Quasi-anharmonic analysis of apo-M11 simulations indicates how coupled motions in control the opening and closing of the BH3 binding site. (A) Projection of the 1 s apo-M11 simulations along the top three anharmonic modes () shows the presence of at least 4 putative substates in the landscape that have distinct structural (and energetic) features. Each conformation in the projection plot is colored accorting to the RMSD with respect to the apo-M11 (2ABO crystal structure) and one can observe the separation between low (blue) and high (green/red) in this low dimensional representation. (B) Projection of the holo-M11 simulations (shown in orange dots) onto the subspace spanned by the top three anharmonic modes by the apo- simulations (from the left hand panel) reveal partial overlaps between the apo- and holo-M11 simulations. Notably, the overlaps span areas that have a lower RMSD (blue conformers in the left hand panel) and higher RMSD (green conformers in the left hand panel). (C–E) Analysis of the motions encoded in the top three anharmonic modes from the apo-M11 simulations show distinct coupling between the motions of to that of the opening/closing of the BH3 domain interaction site. The motions are shown in a movie like representation with darker tones showing the initial state and subsequent frames being shown in lighter tones.

