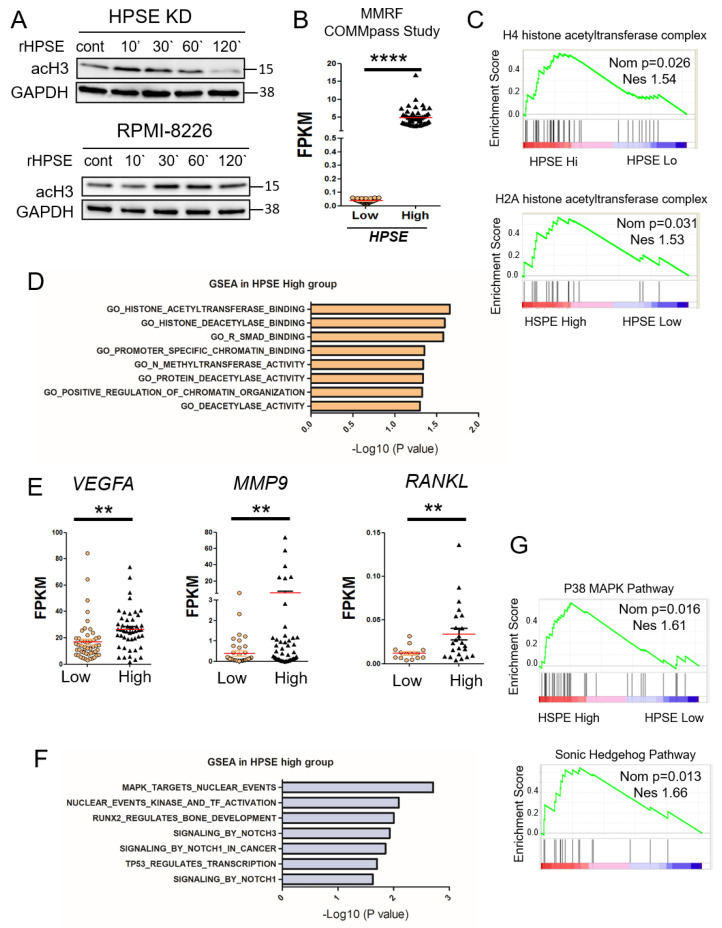
Figure 2.
Heparanase stimulates histone acetylation and upregulation of genes that promote an aggressive tumor phenotype. (A) CAG HPSE KD and RPMI-8226 cells were incubated with 1 µg/mL of rHPSE for the indicated time and acetyl-histone 3 expression assessed by Western blot. (B) Data from the MMRF CoMMpass study were mined to assess the level of heparanase expression in a set of patients with >50% CD138+ cells. Results were plotted for patients with low heparanase (HPSE-low) expression (FPKM < 0.1; n = 50) and high heparanase (HPSE-high) expression (FPKM > 2, n = 50). The red bars represent the mean expression level of each group; **** p < 0.0001 by one-tailed, impaired t-test. (C) Gene set enrichment analysis (GSEA) was performed on the HPSE-high and HPSE-low patient groups, revealing enhanced acetyl-transferase signatures for H4 and H2A in the HPSE-high group. (D) GSEA revealed a number of genes elevated in the HPSE-high patient group that are associated with chromatin organization. (E) Expression levels in HPSE-low and HPSE-high groups of VEGFA, MMP9 and RANKL mRNA, genes known to be associated with an aggressive tumor phenotype. ** p < 0.01 by one-tailed, unpaired t-test. (F) Top significant genes from Reactome gene sets enriched in HPSE-high patient group and ranked by -log10 p-value. (G) Biocarta gene set for p38-MAPK and Sonic-Hedgehog pathway show upregulation in HPSE-high compared to HPSE-low expressing patient tumors. Nominal p-value (Nom p) and normalized enrichment score (NES) are shown for each GSEA.

