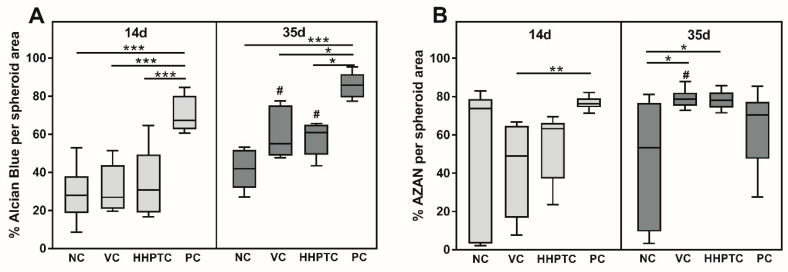
Figure 7.
For quantitative analysis of Alcian blue (A) and AZAN staining (B), the relative blue stained area was determined with ImageJ. For normalization, the measured blue stained area was divided by the total area of the spheroid slice. Data are presented as boxplots with minimum, 25th percentile, median, 75th percentile and maximum. Statistical analysis was performed using Repeated Measures Two-way ANOVA with Bonferroni’s multiple comparison as post hoc test. Significance: * p < 0.05, ** p < 0.01, *** p < 0.001 between treatments and # p < 0.05 comparison between day 14 and 35.

