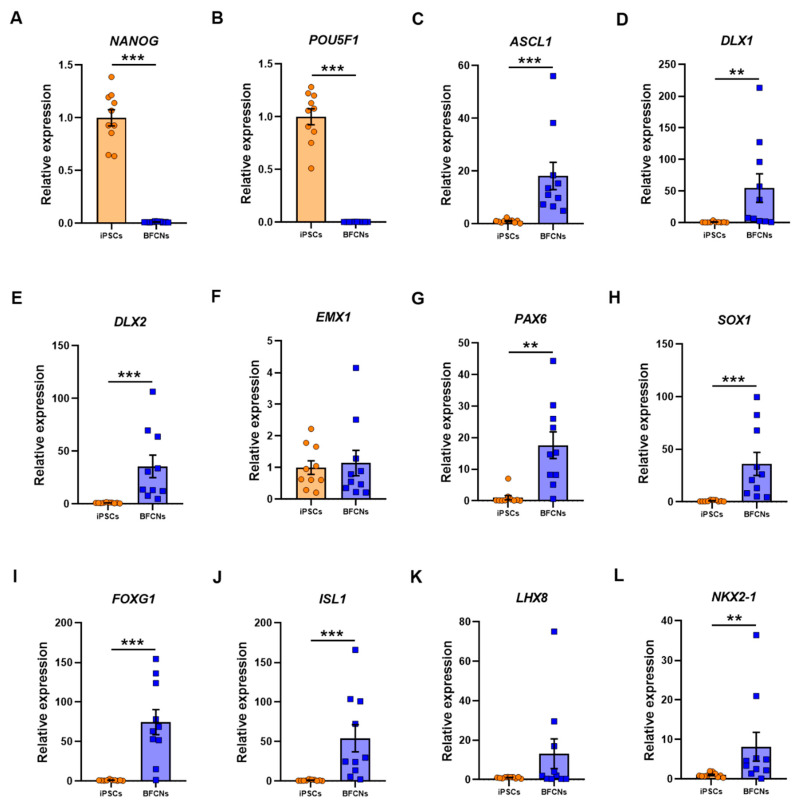
Figure 3.
Expression of pluripotency, neuronal progenitors and specific cholinergic progenitor markers in iPSC and BFCN cultures. The iPSC and BFCN samples were analysed by nCounter (Nanostring) and, after normalisation of total amount of RNA molecules to the housekeeper genes, results are shown as fold change of BFCN cultures over iPSCs. Analysis of the pluripotency markers (A) NANOG and (B) POU5F1; the neuronal progenitor markers (C) ASCL1, (D) DLX1, (E) DLX2, (F) EMX1, (G) PAX6; and (H) SOX1; and the specific cholinergic progenitor makers (I) FOXG1, (J) ISL1, (K) LHX8 and (L) NKX2−1. Data are derived from 10 iPSC lines and 10 BFCN differentiated samples from 1 independent differentiation for each line. Individual data are shown. Histogram bars represent mean values and error bars represent S.E.M. Graphs show ** p ≤ 0.01, *** p ≤ 0.001, by Kolmogorov-Smirnov test except in A and B that two-tailed t-test was used for parametric distribution.

