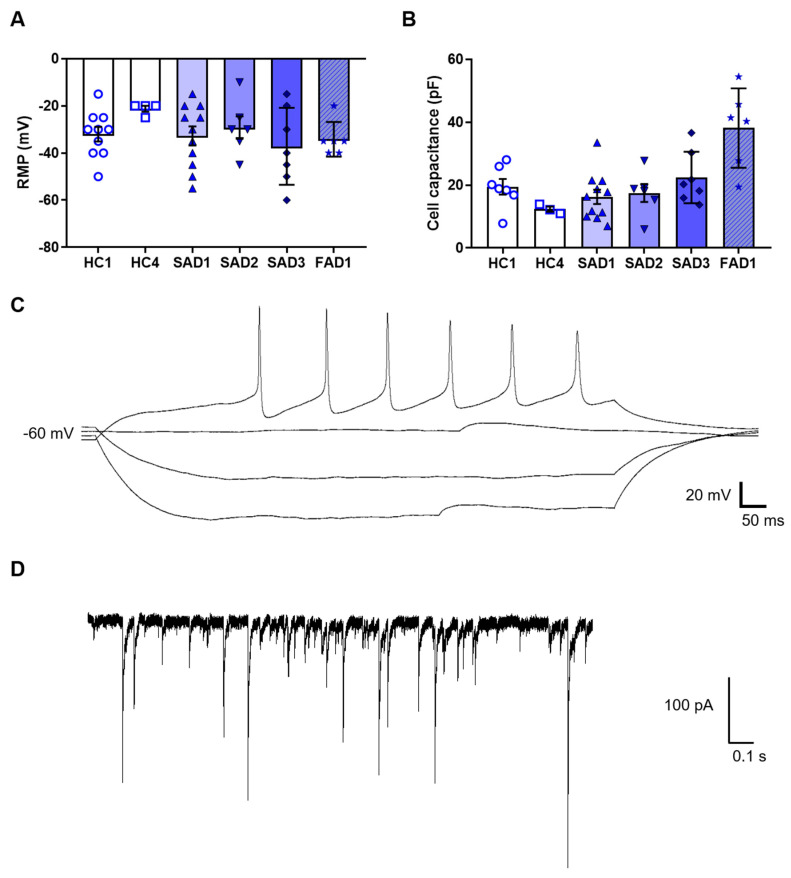
Figure 6.
Electrophysiology data of BFCN cultures at week 4 of maturation. (A) Resting membrane potential and (B) cell capacitance. (C) Sample trace of a train of action potentials when membrane potential was held at −60 mV. (D) Sample trace of synaptic events. Data in A and B were derived from 6 BFCN differentiated samples. Individual data points representing individual cells are shown. Histogram bars represent mean values and error bars represent S.E.M.

