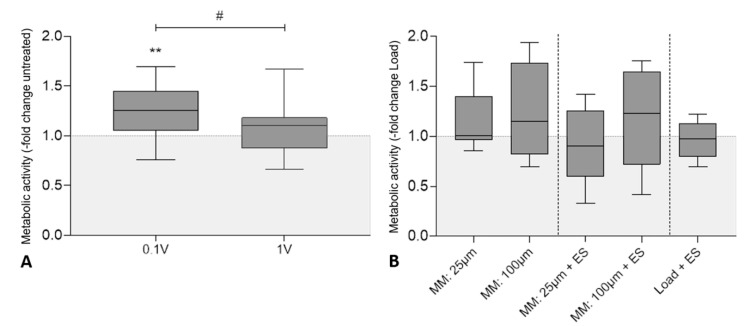
Figure 3.
Metabolic activity of human osteoblasts after biophysical stimulation. (A) Results of electrical stimulation (ES) with 60 kHz and either 100 mVRMS or 1 VRMS. (B) Results of micromotions and electrical stimulation with 60 kHz and 1 VRMS (MM + ES) compared to osteoblasts treated solely with micromotions (MM) and osteoblasts treated with titanium bodies and electrical stimulation (Load + ES). Untreated cells with or without titanium bodies served as controls. The metabolic activity was determined colorimetrically by the conversion of tetrazolium salt to formazan. Results are presented as box plots related to the untreated controls (n ≥ 6). ** p < 0.01 compared to the untreated controls (Wilcoxon’s signed-rank test); # p < 0.05 comparison between different voltages (Mann–Whitney U test).

