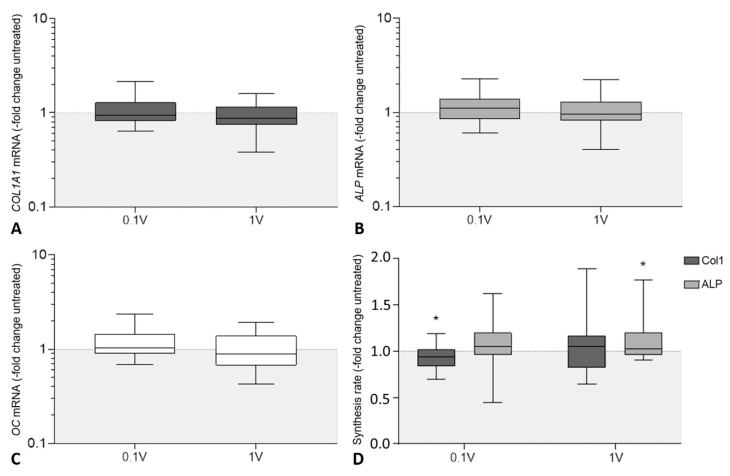
Figure 4.
Evaluation of osteogenic differentiation of human osteoblasts following electrical stimulation [ES] with 60 kHz and either 100 mVRMS or 1 VRMS. Relative gene expression of osteogenic markers for bone formation: (A) collagen type I alpha 1 chain (COL1A1), (B) alkaline phosphatase (ALP) and (C) osteocalcin (OC). Gene expression levels of osteogenic marker were determined via semi-quantitative polymerase chain reaction (qPCR). Results are presented as boxplots of the percentage of 2(−ΔΔCt) related to untreated controls (n ≥ 24). (D) Synthesis rates of osteogenic markers procollagen type 1 and alkaline phosphatase (ALP). The release of type I C-terminal collagen propeptide in the cell culture supernatant was determined using ELISA and related to the total protein concentration. The ALP activity was determined colorimetrically by the hydrolysis of p-nitrophenyl phosphate. Results are presented as box plots related to untreated controls (n ≥ 15). * p < 0.05 compared to the untreated controls (Wilcoxon’s signed-rank test).

