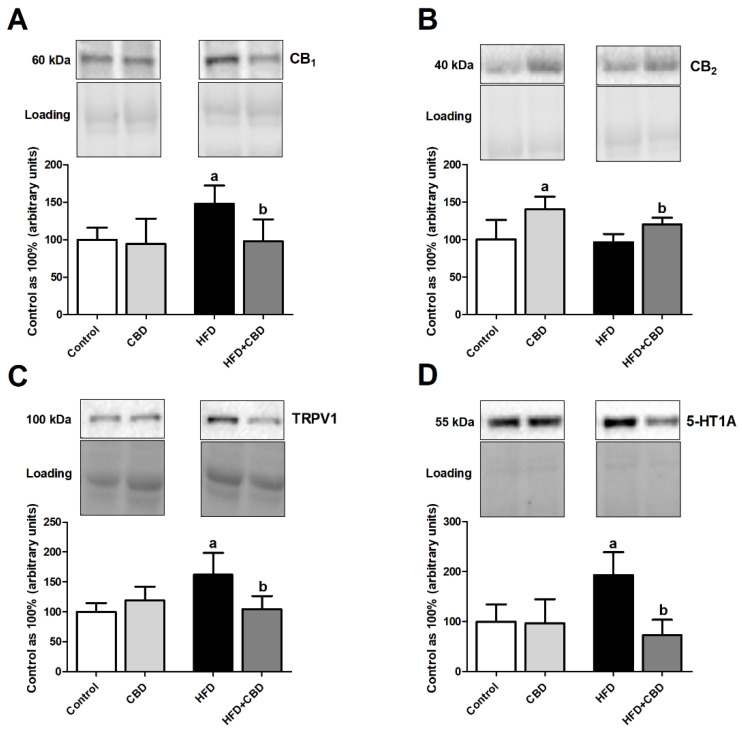
Figure 4.
The total expression of (A) cannabinoid receptor 1 (CB1), (B) cannabinoid receptor 2 (CB2), (C) transient receptor potential channel 1 (TRPV1), and (D) serotonin receptor (5-HT1A) in red gastrocnemius muscle in the control (standard diet) and high-fat diet (HFD) groups after chronic cannabidiol (CBD) treatment. The total expressions of the above proteins are presented as a percentage difference compared to the control group, which was set as 100%. The data are expressed as mean values ± SD, n = 6 in each group. a p < 0.05 significant difference: control group vs. examined group; b p < 0.05 significant difference: HFD vs. HFD + CBD.

