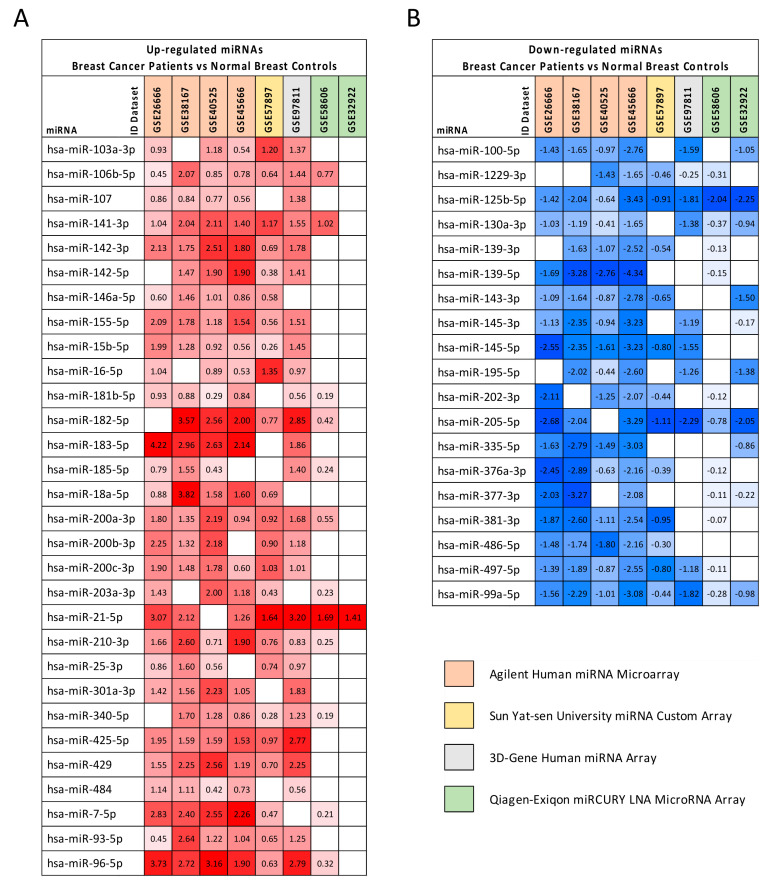
Figure 1.
Differentially expressed miRNAs in BC samples compared to normal breast tissues in at least five out of eight datasets. The results of differential analyses were expressed as log2FC values indicating with red scale boxes the upregulated miRNAs (Panel (A)) and with blue scale boxes the downregulated ones (Panel (B)). Dataset IDs were marked with different colors depending on the platform technology used.

