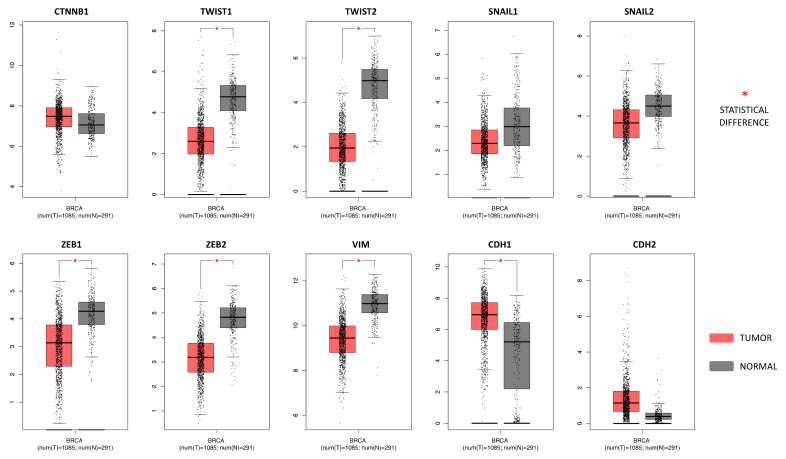
Figure 3.
EMT gene expression levels in breast cancer samples compared to the controls. The GEPIA software performs a four-way ANOVA differential analysis (using sex, age, ethnicity, and disease state (tumor or normal) as variables for calculating differential expression. The p-values were adjusted according to the Benjamini and Hochberg false discovery rate. The p-value threshold was set at 0.01 (* = p < 0.01). The relative expression levels were first log2(TPM+1) transformed and the log2FC was defined as median (Tumor)—Median (Normal), where TPM is the transcript count per million.

