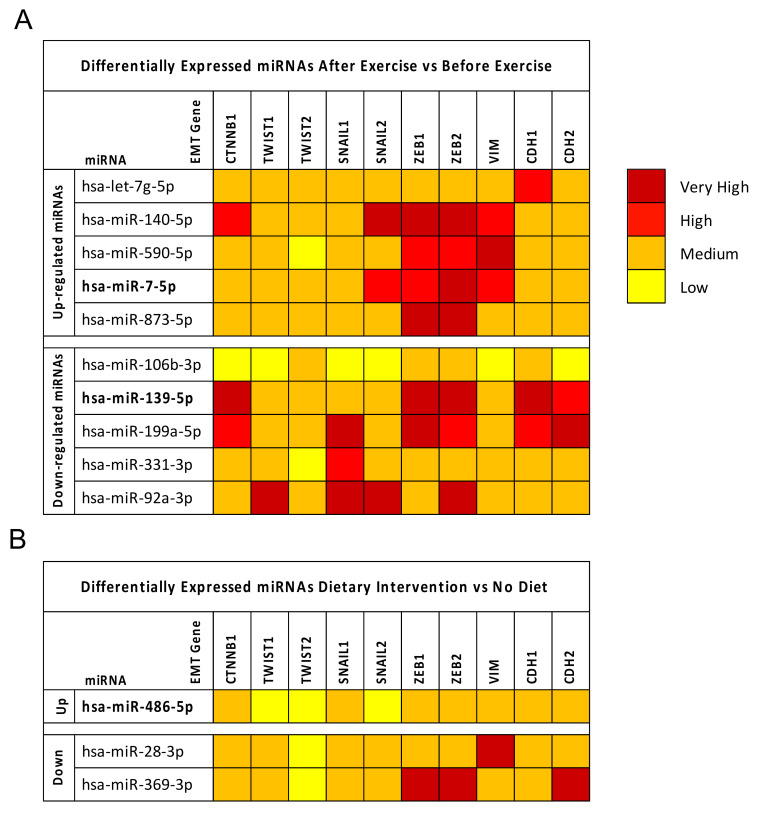
Figure 5.
Panel (A): Interaction levels between EMT genes and miRNAs modulated by exercise. Panel (B): Interaction levels between EMT genes and miRNAs modulated by diet. The intensity of miRNA–gene interactions is reported as a red color scale ranging from yellow (low interaction levels) and dark red (very high interaction levels). For each EMT gene is reported the level of interaction with the computationally selected BC miRNAs.

