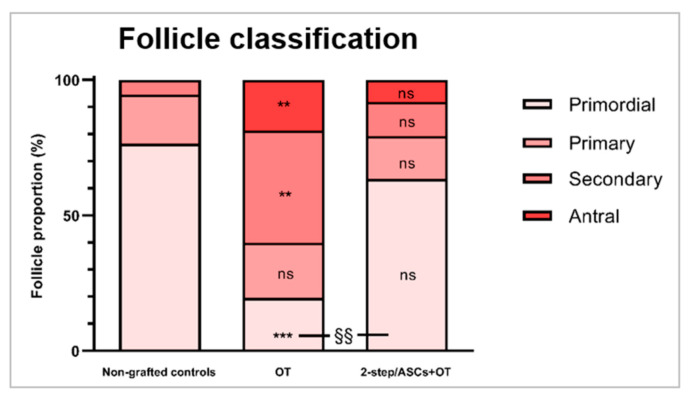
Figure 4.
Stacked percentages of each follicle stage (primordial, primary, secondary, and antral) were compared between groups (non-grafted controls, OT, and 2-step/ASCs+OT) with the one-way ANOVA and Tukey’s post hoc test. Differences between the grafted groups and non-grafted controls: ** p < 0.01, *** p < 0.0001. Differences between the OT and 2-step/ASC+OT groups: §§ p < 0.01). OT: ovarian tissue. ASCs: adipose tissue-derived stem cells. ns: not significant.

