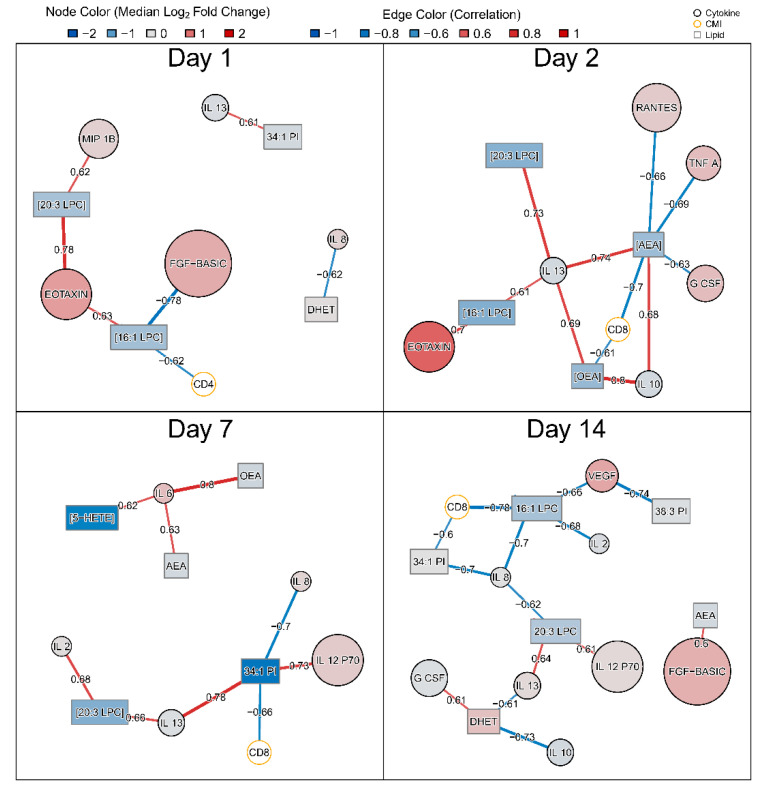
Figure 6.
Spearman correlation network summarizing associations between DA lipid fold changes and changes in serum cytokines as well as peak T-cell activation. Pairwise Spearman correlations were assessed between fold changes of 14 DA lipids and 22 serum cytokines by post-vaccination day. In addition, correlations with peak CD4+ and CD8+ T-cell activation on days 7, 14, or 28 and tularemia-specific microagglutination were assessed. Black nodes represent lipids (rectangles) and cytokines (circles) while edges represent the Spearman correlation between fold changes. T-cell activation variables are shown in orange circles. Cytokine and lipid nodes are color-coded by log2 fold change. Edges are color coded and edge widths are scaled by Spearman correlation. To facilitate visual interpretation, networks were filtered for Spearman correlation ≥ 0.6.

