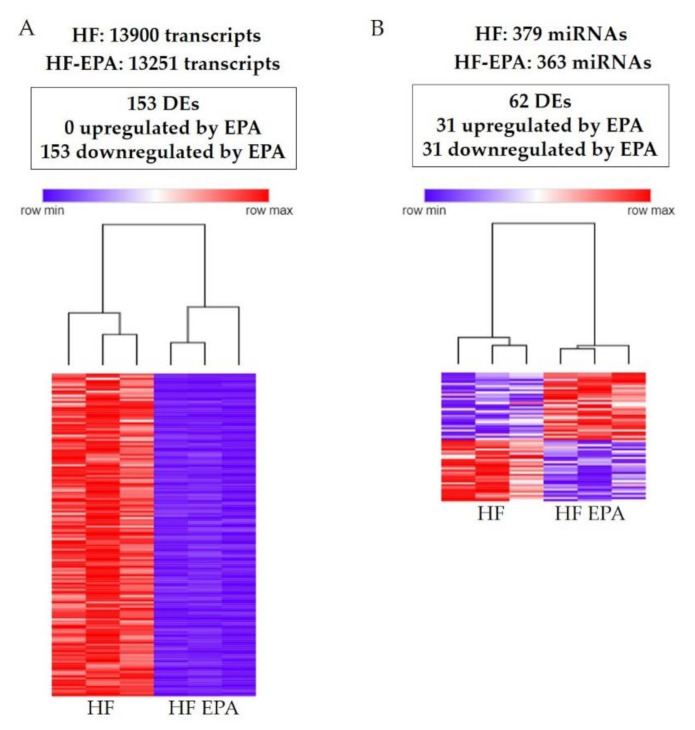
Figure 1.
Gene and miRNA profiling and Hierarchical clustering process in obese B6 mice. (A). 153 DE genes identified following RNA sequencing for HF vs. HF-EPA in visceral adipose tissue (VAT). Zero genes were upregulated and 153 were respectively downregulated with EPA (false discovery rate (FDR)-adjusted p value ≤ 0.05, fold change ≥ 1.5, reads per kilo base per million mapped reads (RPKM) ≥ 0.3). Hierarchical clustering shows that 153 DE genes in VAT were differentially regulated by EPA. The horizontal line represents the different diets (HF vs. HF-EPA), and the vertical line represents the list of genes. Lower values are represented with blue tones, while higher values have yellow tones (FDR-adjusted p value ≤ 0.05, fold change ≥ 1.5, RPKM ≥ 0.3). (B) 62 DE miRNAs were identified following RNA sequencing for HF vs. HF-EPA in VAT. Thirty-one miRNAs were upregulated and 31 were respectively downregulated by EPA (FDR-adjusted p value ≤ 0.05, log2 fold change > 1.25, RPKM ≥ 3.34). Hierarchical clustering demonstrates that 62 DE miRNAs in VAT were differentially regulated by EPA. The horizontal line represents the different diets (HF vs. HF-EPA), and the vertical line represents the list of miRNAs. Lower values are represented with blue tones, while higher values have yellow tones (FDR-adjusted p value ≤ 0.05, log fold change > 1.25, RPKM ≥ 3.34). HF, high fat; HF-EPA, HF diet supplemented with EPA; DE, differentially expressed.

