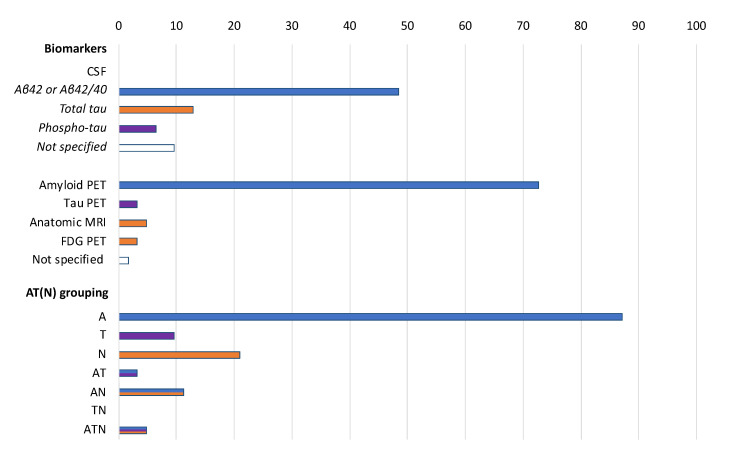
Figure 2.
Biomarkers adopted to ascertain eligibility in the selected protocols (n = 62) according to the AT (N) grouping. Data are shown as %. A: aggregated Aβ or associated pathologic state; T: aggregated tau (neurofibrillary tangles) or associated pathologic state; N: neurodegeneration or neuronal injury. Colors refer to AT (N) biomarker grouping: blue: A; purple: T; orange: N.

