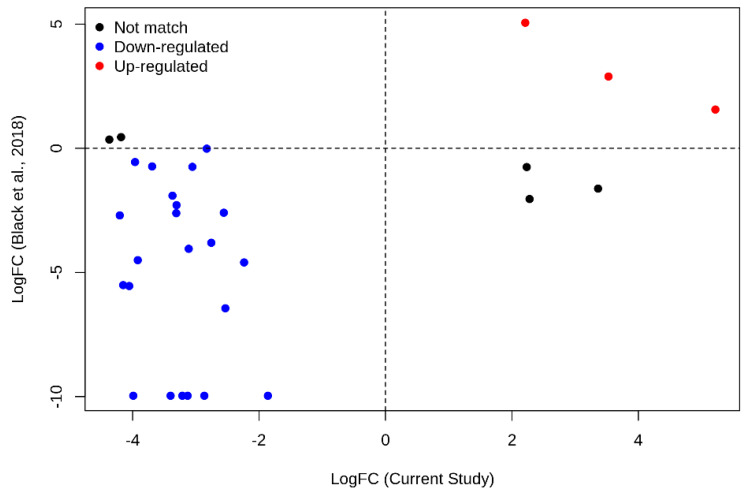
Figure 3.
In–silico validation using PRJNA475681. Scatter plot showing the expression trend (i.e., logFC) of the 30 lncRNAs found in the current study compared with the Bioproject PRJNA475681 (childhood B-ALL RNA-Seq dataset by Black et al. [50], 2018). The values relative to lncRNAs scored down-regulated and up-regulated in both studies are highlighted in blue and red, respectively; instead, values relative to lncRNA with the opposite trend in the two studies are highlighted in black.

