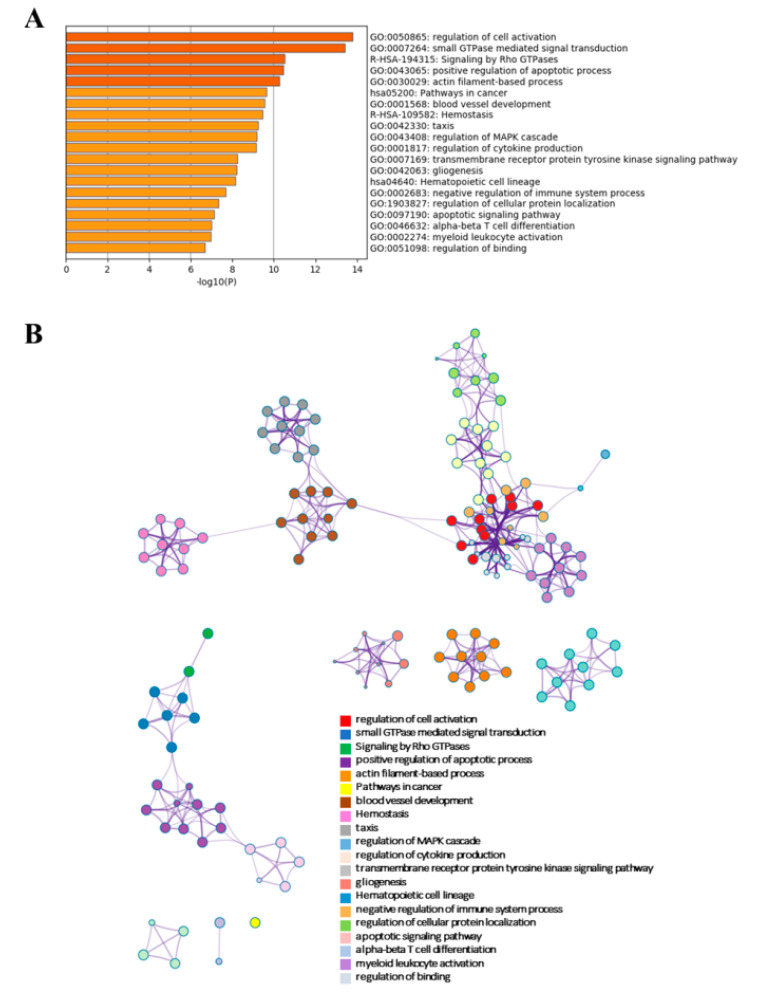
Figure 4.
Signalling pathways regulated by protein–coding genes (PCGs) according to Gene Ontology (GO), Reactome and Kyoto Encyclopedia of Genes and Genomes (KEGG) database. (A) Top statistically significant enriched signalling pathways (−log10p > 6) with accumulative hypergeometric p–values and enrichment factors calculated and used for filtering from overall enrichment analysis. (B) Enriched ontology clusters shown as a network only for the subset of representative biological processes (−log10p > 6, accumulative hypergeometric p–values) from the full enrichment analysis. Each term is represented by a circle node. Top statistically significant terms are hierarchically clustered into a tree based on Kappa–statistical similarities (score > 0.3) among their gene memberships, linked by an edge (the thickness of the edge represents the similarity score). Each cluster has a colour and term description.

