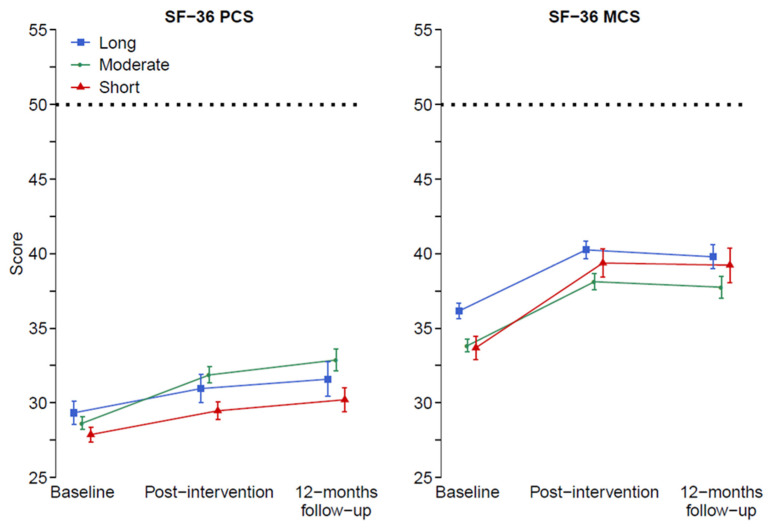
Figure 2.
Change of health-related QoL from baseline to post intervention and 12 months follow-up, measured by SF-36 Physical Component Summary (PCS), Mental Component Summary (MCS). High values indicate better status. In the model, adjustment was made for baseline status and treatment days/week. Note: graphs show unadjusted baseline values, while statistical analysis was controlled for differences at baseline. Dashed lines indicate norm value for general population.

